$SPONGE (SPONGE/USD) Stumbles at $0.000045, Eyes Rebound
Estimated Reading Time: 3 minutes
Don’t invest unless you’re prepared to lose all the money you invest. This is a high-risk investment and you are unlikely to be protected if something goes wrong. Take 2 minutes to learn more

In the previous analysis of the $SPONGE market, it was projected that the price could find bullish support around the $0.000045 level, establishing this as a key support zone after the recent bullish momentum peaked at $0.00005. The market consolidated around this level for some time; however, bearish pressure eventually intensified, driving the crypto signal below this critical threshold. The market is now approaching the significant $0.00004 price level, where there is potential for renewed bullish sentiment.
Key Market Dynamics:
- Resistance Levels: $0.0010, $0.0011, $0.0012
- Support Levels: $0.000020, $0.0000195, $0.000019
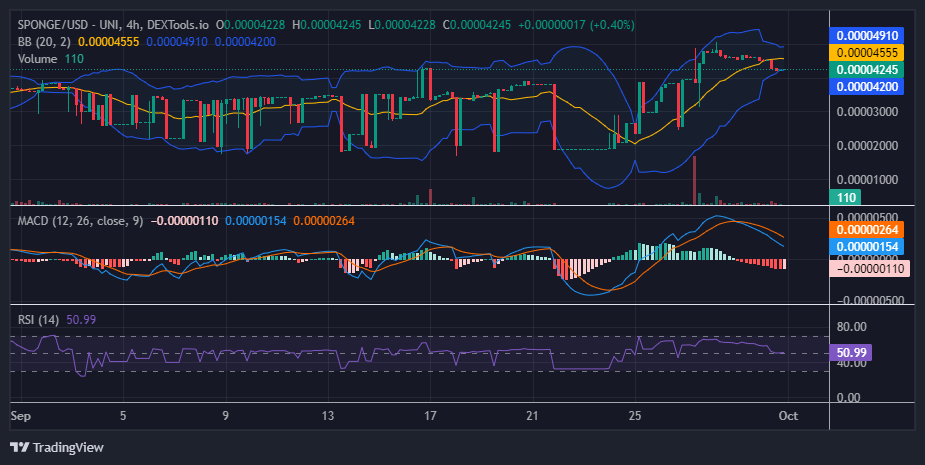
$SPONGE (SPONGE/USD) Technical Outlook
Analyzing the chart, we can observe that the extreme market volatility has significantly decreased, particularly as bullish momentum has strengthened, pushing the price above the $0.000045 level. The Bollinger Bands’ bandwidth has narrowed considerably, suggesting that the market may be beginning to move in a clearer direction. However, current indicators point to bearish pressure dominating the market. The Moving Average Convergence Divergence (MACD) has already formed a bearish crossover above the zero level, while the Relative Strength Index (RSI) reflects balanced market momentum at the 50 mark. Although the price currently stands at $0.000042, the market may find renewed bullish strength around the $0.00004 level, as the bearish trend appears to be slowing near this critical price point.
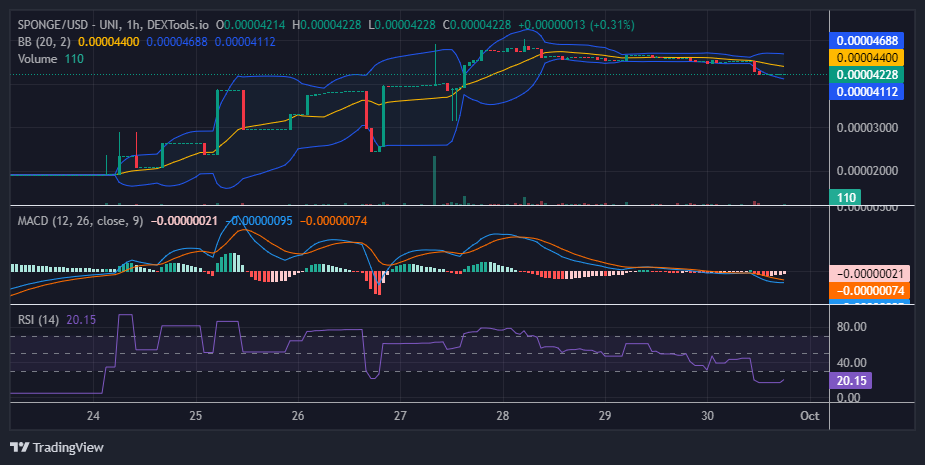
SPONGE/USD 1-Hour Chart Insights
In the shorter time frame, the market appears more bearish from this perspective. The Relative Strength Index (RSI) is measuring momentum below the 30 level, indicating that the market is oversold, which could limit further selling pressure. Additionally, as observed from the 4-hour chart, the bearish trend is showing signs of exhaustion as it approaches the critical $0.00004 price level. Investors should anticipate a potential resurgence in buying interest.
Buy SPONGE/USD!
When someone tells you to buy $SPONGE before #altseason pic.twitter.com/30Cen9Tr8K
— $SPONGE (@spongeoneth) September 30, 2024
Join the SPONGE community and be part of the next big crypto sensation! Buy Sponge ($SPONGE) today!