Ethereum (ETH) Is Range Bound between $2,700 and $2,900, a Fresh Uptrend Is Likely
Estimated Reading Time: 2 minutes
Don’t invest unless you’re prepared to lose all the money you invest. This is a high-risk investment and you are unlikely to be protected if something goes wrong. Take 2 minutes to learn more

Ethereum Price Long-Term Analysis: Bullish
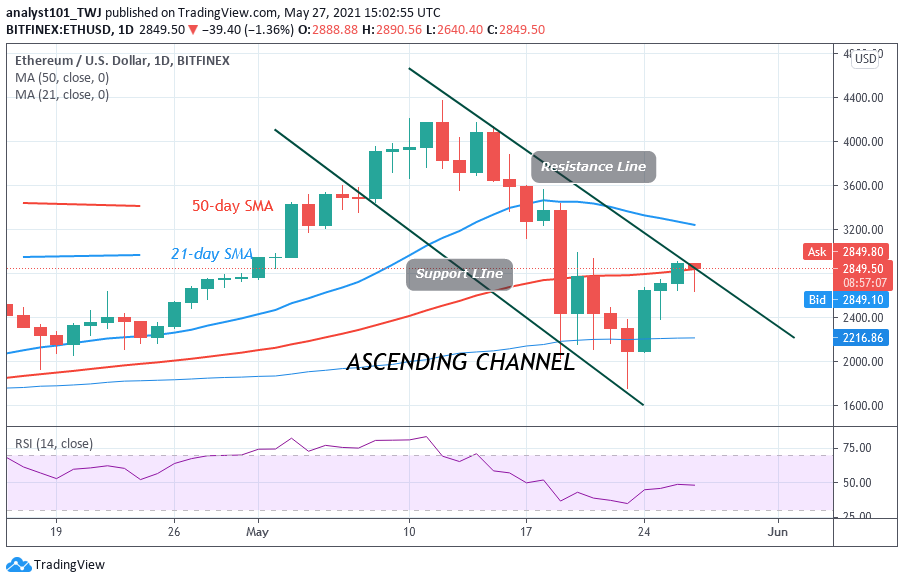
On May 23, Ethereum reached bearish exhaustion as the altcoin dropped to the low of $1,755. For the past five days, the biggest altcoin has been rising after the recovery. Ether has risen to $2,900 high but the uptrend was resisted. Since May 26, Ether has been compelled to a sideways move. The crypto will fall to $2,700 low after each rejection. On the upside, if buyers breach $2,900 resistance and push above the $3,250 support, Ethereum will be out of the bearish trend zone.
Ethereum Indicator Analysis
Ethereum is at level 47 of the Relative Strength Index period 14. Ether price is still in the bearish trend zone and it is capable of falling on the downside. The 21-day and 50-day SMAs are sloping upward indicating the uptrend. The crypto’s price is below the moving averages which suggests that the altcoin is in the bullish trend zone.

Technical indicators:
Major Resistance Levels – $2, 600, $2,800, $3,000
Major Support Levels – $1.500, $1, 300, $1,100
What Is the Next Direction for Ethereum?
Ethereum has resumed its upward move but the uptrend is facing resistance at $2,900. Meanwhile, on May 25 uptrend; a retraced candle body tested the 61.8% Fibonacci retracement level. The retracement indicates that ETH is likely to rise to level 1.618 Fibonacci extension or $3,319.59 .

Note: Cryptosignals.org is not a financial advisor. Do your research before investing your funds in any financial asset or presented product or event. We are not responsible for your investing results