Orchid (OXT/USD): Bulls Firmly in Control, Targeting $0.100
Estimated Reading Time: 3 minutes
Don’t invest unless you’re prepared to lose all the money you invest. This is a high-risk investment and you are unlikely to be protected if something goes wrong. Take 2 minutes to learn more

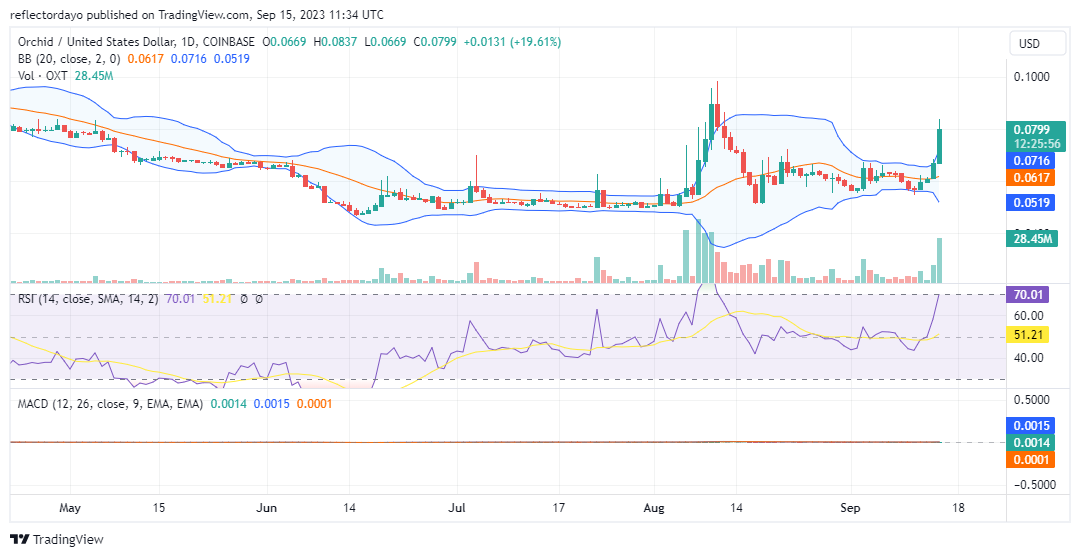
Following a brief period of volatility consolidation around the $0.0617 price level, the Orchid market has initiated a bullish breakout. Notably, this surge has generated a notable upswing in investor interest, driving the price vigorously higher. Presently, the market has reached the $0.08 price level.
Typically, in the presence of such robust bullish momentum, it is reasonable to anticipate a substantial bearish response upon encountering significant resistance levels, such as the current $0.08 price threshold. However, there are indications that bullish sentiment remains resilient, as bearish sentiment appears to be in limited supply.
This suggests that the bull market may still possess the potential for further upward movement. Careful monitoring of price action and market dynamics is advised to gauge the sustainability of this upward trajectory.
Orchid Market Data
- OXT/USD Price Now: $0.0800
- OXT/USD Market Cap: $63,168,888
- OXT/USD Circulating Supply: 962,629,339 OXT
- OXT/USD Total Supply: 1,000,000,000 OXT
- OXT/USD CoinMarketCap Ranking: #256
Key Levels
- Resistance: $0.07, $0.08, and $0.085.
- Support: $0.05, $0.045, and $0.04.
Price Prediction for Orchid: The Indicators’ Point of View
The Bollinger Bands are displaying significant divergence, indicative of a market firmly under the influence of bullish sentiment. Furthermore, the Orchid trade volume indicator registers a substantial histogram, lending strong support to today’s bullish movement. These combined factors signify a notable control exerted by the bulls over today’s market dynamics.
It is worth noting, however, that a modicum of bearish sentiment appears to be emerging at the critical resistance level of $0.08. Nonetheless, this bearish influence remains relatively limited in its scope. The bullish trajectory may persist, with the next target set at the $0.10 price level.
Should the bulls successfully breach the $0.08 price barrier, it could potentially trigger a more significant bearish response around the $0.09 price mark. Such forceful bullish movements as witnessed here often have the capacity to incite a robust bearish market reaction. Vigilance in monitoring market developments remains crucial.
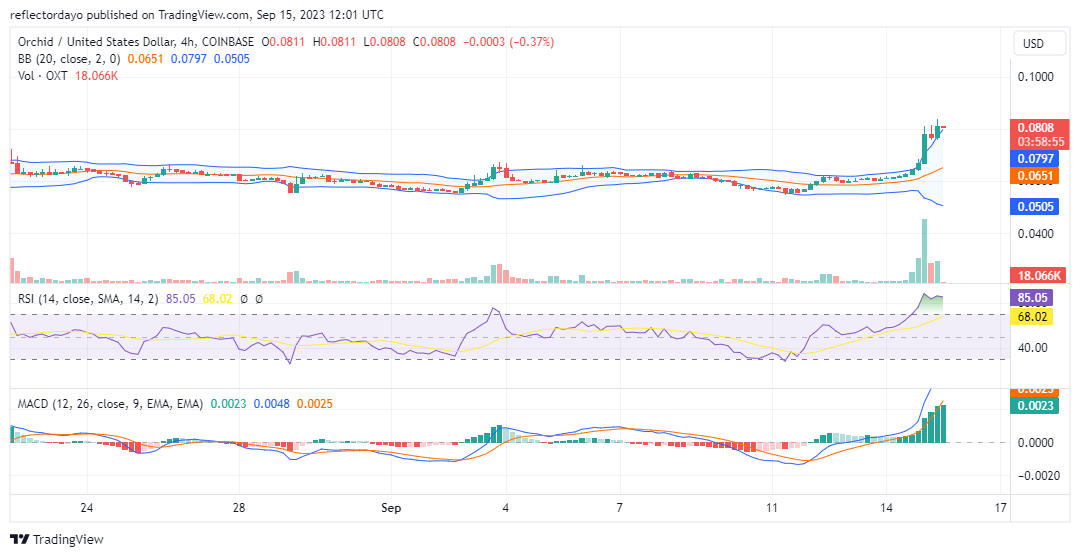
OXT/USD 4-Hour Chart Outlook
In a shorter timeframe, Orchid has found support near $0.077, close to the critical $0.08 level, allowing bullish traders to pressure this key resistance. Despite the overbought signal from the Relative Strength Index (RSI), indicating a potential bearish correction due to trading above intrinsic value, the prevailing bullish sentiment may keep the market overbought for some time. However, caution is necessary, as an extended bullish trend could eventually lead to a notable bearish reversal. Ongoing monitoring is recommended.