Orchid (OXT/USD) Continues Its Gradual Climb Toward August 11th Peak
Estimated Reading Time: 3 minutes
Don’t invest unless you’re prepared to lose all the money you invest. This is a high-risk investment and you are unlikely to be protected if something goes wrong. Take 2 minutes to learn more
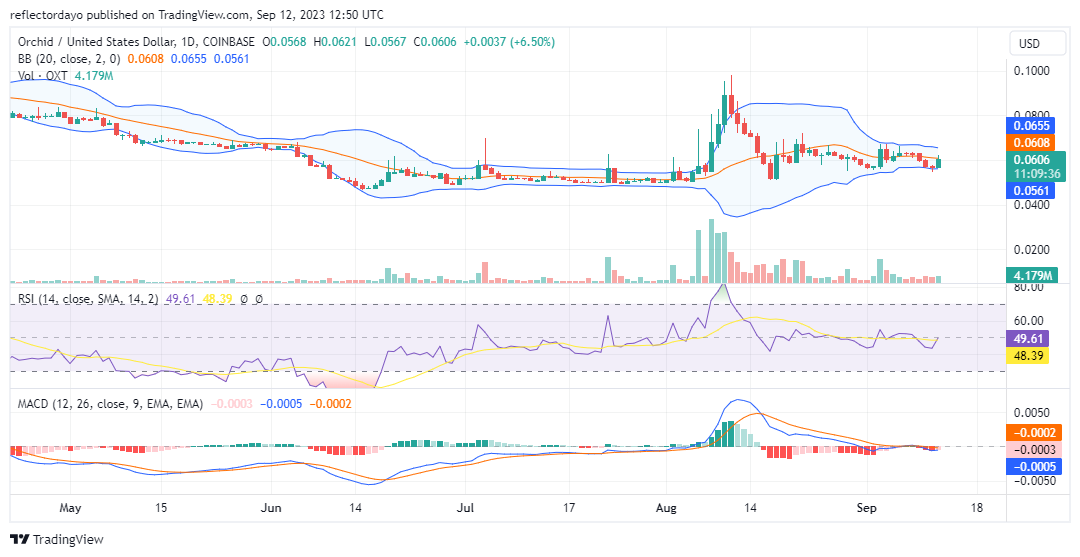
On August 11th, Orchid’s bull market reached its zenith, nearing the $0.100 price threshold. However, bearish sentiment swiftly emerged as traders sought to capitalize on the substantial price surge and secure their profits. In response, the bulls managed to establish a critical juncture slightly above the previous support level of $0.0488. This new support level was solidified at $0.0515 on August 17th.
Moving into early September, the market further solidified its support at a slightly higher level. Notably, the market began a phase of consolidation above this newfound price point. It is worth contemplating the possibility of a potential breakout in this context.
Orchid Market Data
- OXT/USD Price Now: $0.066
- OXT/USD Market Cap: $58,594,274
- OXT/USD Circulating Supply: 962,629,339 OXT
- OXT/USD Total Supply: 1,000,000,000 OXT
- OXT/USD CoinMarketCap Ranking: #311
Key Levels
- Resistance: $0.07, $0.08, and $0.085.
- Support: $0.05, $0.045, and $0.04.
Price Prediction for Orchid: The Indicators’ Point of View
The recently established support level has shifted slightly upward to $0.0565. From this point, the price has shown signs of recovery, with an apparent attempt to reach the 20-day moving average. Additionally, the Bollinger Bands indicator initiated a convergence pattern on September 3rd. This convergence is notable for creating a narrow price channel, indicative of reduced market volatility.
Furthermore, it is evident that the market has entered a state of equilibrium. The Orchid market is currently retracing towards the midpoint, signifying the point of equilibrium. Consequently, the potential for a price breakout becomes increasingly relevant. Traders are advised to closely monitor the market’s movement towards the upper standard deviation; any noticeable impact on this indicator could signal an impending market breakout.
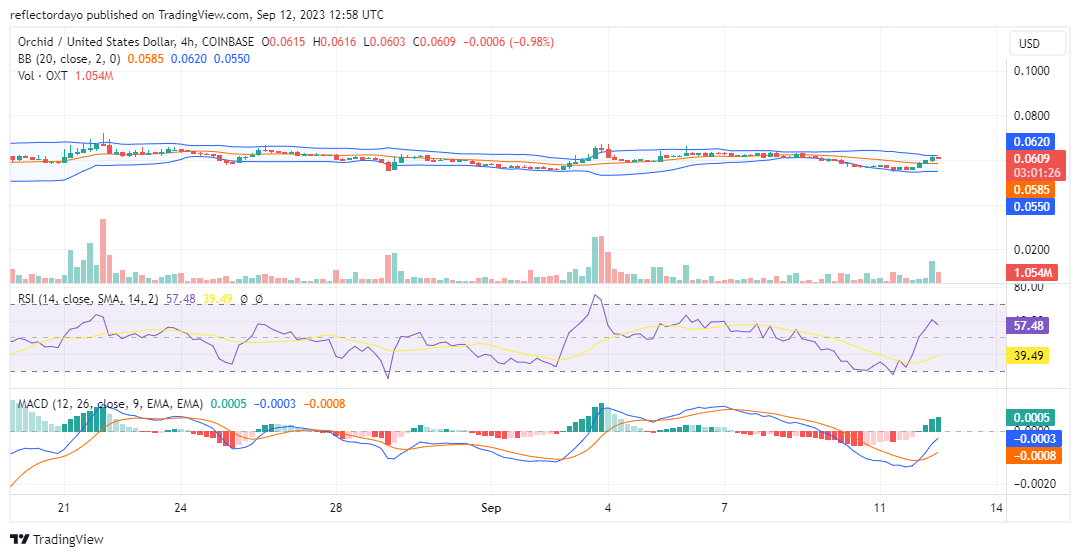
OXT/USD 4-Hour Chart Outlook
In the shorter time frame, we noticed the market gaining upward traction within a narrow price channel. The sustained bullish momentum within a narrow channel may indicate an accumulation of buying pressure. This could potentially lead to a breakout above the upper boundary of the channel.
However, the implication of the bullish movement within a narrow price channel underscores the need for bulls to overcome the near resistance that will keep the market on an upside trajectory.