Enjin Coin (ENJ/USD) Reclaims the Crucial $0.250 Price Level
Estimated Reading Time: 2 minutes
Don’t invest unless you’re prepared to lose all the money you invest. This is a high-risk investment and you are unlikely to be protected if something goes wrong. Take 2 minutes to learn more
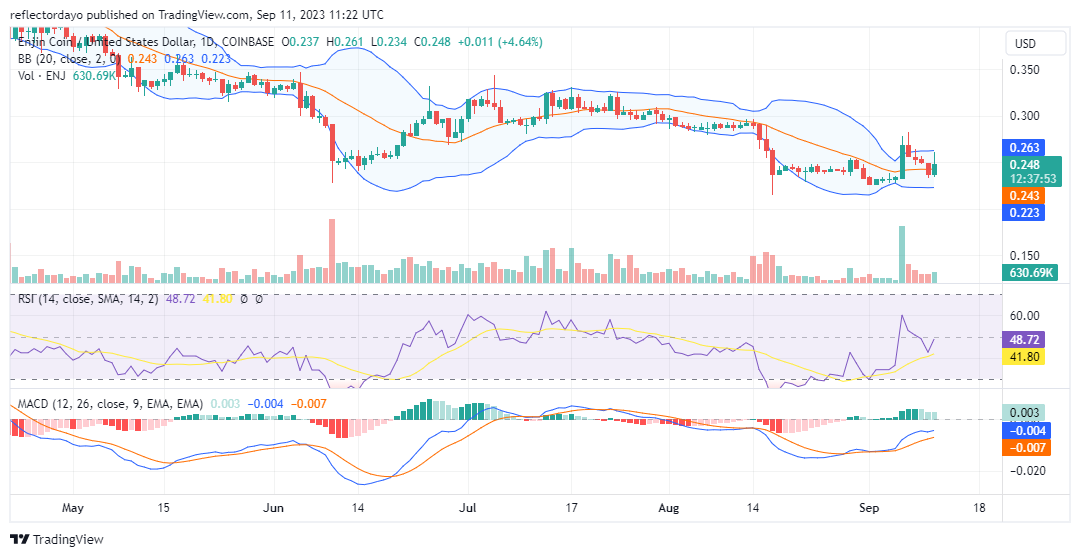
In the latter part of June, ENJUSD saw a significant price surge, starting from a level of $0.250 and reaching up to the $0.300 price range. This uptrend was accompanied by an increase in market volatility. Despite the heightened volatility, the bullish momentum struggled to push the price beyond the $0.300 mark. The market entered a phase of high-frequency oscillation around this critical price level.
During the months of July and August, the previously high-frequency oscillations gradually cooled off. By mid-August, the bulls had lost their grip on the market, causing a slight dip below the $0.250 price level.
Enjin Coin Market Data
- ENJ/USD Price Now: $0.247
- ENJ/USD Market Cap: $246,240,768
- ENJ/USD Circulating Supply: 1,000,000,000 ENJ
- ENJ/USD Total Supply: 1,000,000,000 ENJ
- ENJ/USD CoinMarketCap Ranking: #105
Key Levels
- Resistance: $0.30, $0.35, and $0.40.
- Support: $0.200, $0.150, and $0.15.
Price Prediction for Enjin Coin: The Indicators’ Point of View
During today’s trading session of the Enjin Coin market, there was an effort underway to recapture the pivotal $0.250 price level. Nevertheless, signs of resistance are apparent at this level, as clearly illustrated by the upper shadow observed above $0.250 on the candlestick chart.
Meanwhile, within the Relative Strength Index (RSI) indicator, the market is retracing towards the midpoint, signaling a possible transformation in market sentiment away from overbought conditions towards a more equilibrium state. If the market successfully surpasses this critical threshold, there is potential for the price action to converge, leading to a likely consolidation phase in this particular market range.
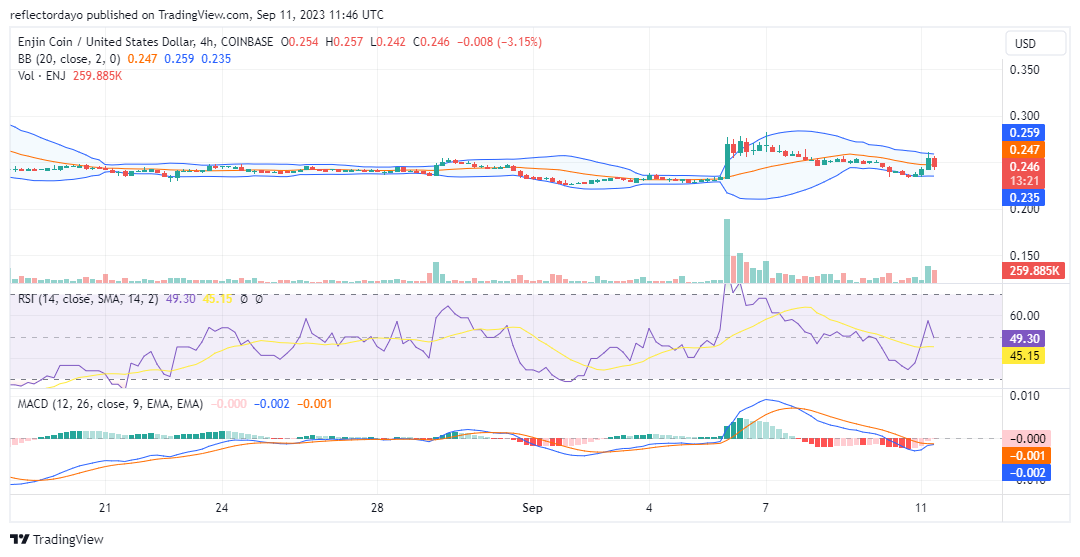
ENJ/USD 4-Hour Chart Outlook
Slightly above the $0.250 price level, there appears to be a minor resistance, causing the price to retreat back to the critical $0.250 price level. Additionally, as the Bollinger Bands converge, the probability of consolidation around this level becomes increasingly likely. This consolidation pattern has the potential to fortify the level, potentially serving as either support or resistance.