ApeCoin (APEUSD) Bear Market Edges Closer to Potential Recovery at $1.33
Estimated Reading Time: 3 minutes
Don’t invest unless you’re prepared to lose all the money you invest. This is a high-risk investment and you are unlikely to be protected if something goes wrong. Take 2 minutes to learn more
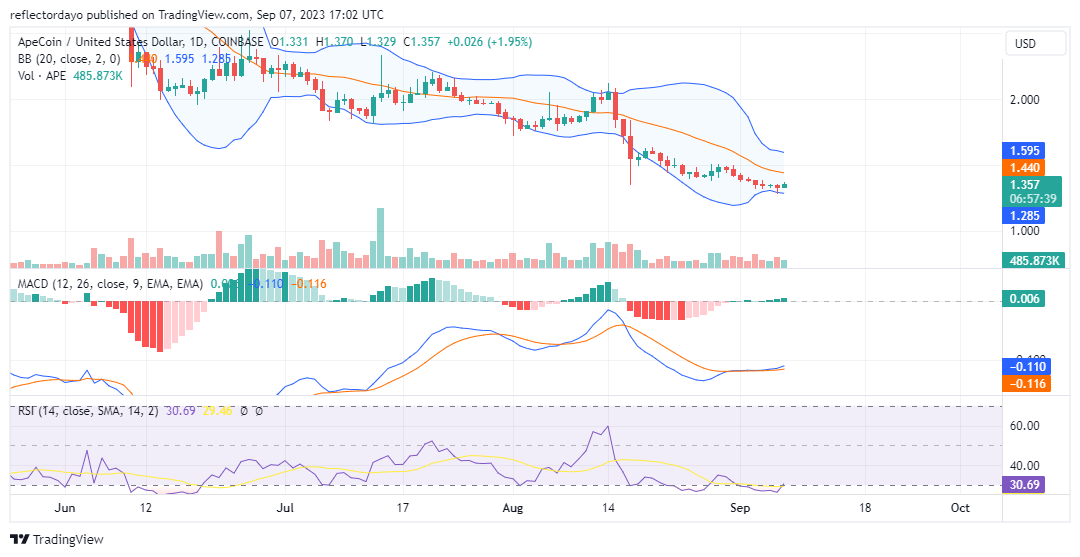
The ApeCoin market has a lengthy history, beginning in March and continuing to the present day. In March, at its peak of $6.43, the bear market was triggered, and it has endured, encountering resistance primarily at key bullish demand levels. In each of these instances, at these demand levels, optimistic traders managed to briefly rally the market, only to eventually succumb to persistent selling pressure.
Once more, around the $1.33 mark, the bear market appears to be slowing down as bullish sentiment gains momentum, resulting in a 3.37% increase during today’s trading session. If buyers can sustain this upward momentum, it may lead to a significant recovery, with bulls potentially following suit.
ApeCoin Market Data
- APE/USD Price Now: $1.36
- APE/USD Market Cap: $36,735,379
- APE/USD Circulating Supply: 368,593,750 APE
- APE/USD Total Supply: 1,000,000,000 APE
- APE/USD CoinMarketCap Ranking: #66
Key Levels
- Resistance: $1.40, $1.45, and $1.50.
- Support: $1.25, $1.20, and $1.15.
Price Prediction for ApeCoin: The Indicators’ Point of View
The Bollinger Bands, despite exhibiting divergent bands, indicated a downtrending price channel. The divergence in the bands was likely a result of heightened liquidity during the bearish period between August 15 and August 17. However, when the ApeCoin market reached the $1.33 price level, it flattened out, and the bands began to converge, coinciding with today’s market gaining approximately 3.37%.
Although this modest price recovery is insufficient to reverse the overall market trend, both the Moving Average Convergence and Divergence (MACD) and the Relative Strength Index (RSI) are displaying signs of a positive market outlook, even though the bull market is still a distant prospect. With the Relative Strength Index now indicating an oversold condition, traders may consider adopting a more positive sentiment and opening long positions.
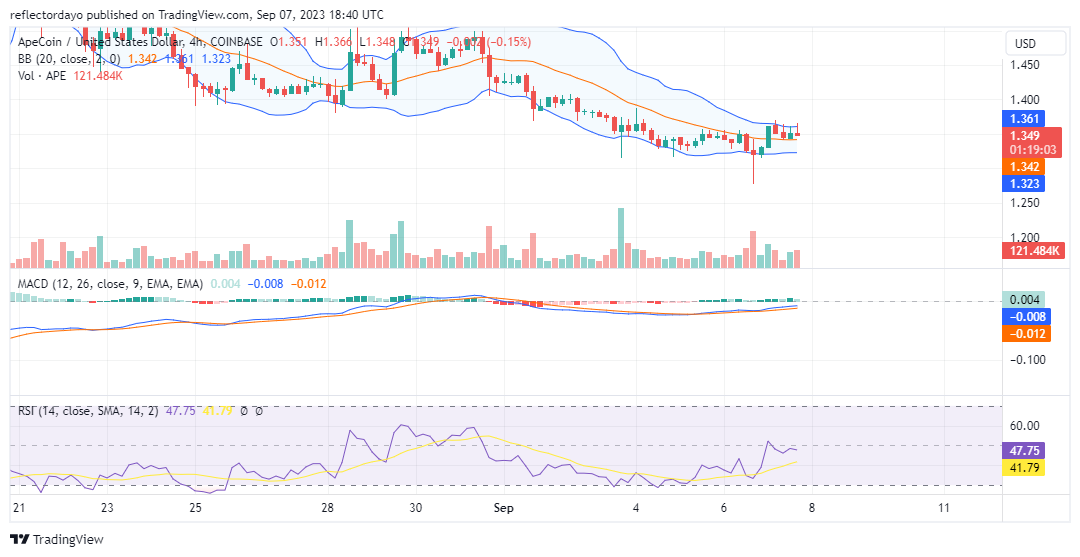
APE/USD 4-Hour Chart Outlook
From a shorter timeframe perspective, we have observed the Bollinger Bands contracting as the price action crossed above the 20-day moving average. This dynamic has led to the bulls mounting a counterattack, exerting pressure against the selling forces in their efforts to defend the critical support level.
Upon analyzing recent price movements, it becomes evident that the bear market has extensively tested lower price levels. The prolonged testing of these lower levels suggests that the bears are encountering difficulties in driving the market further down. If the support level remains intact, it could imply the potential for a reversal, signaling a potential upward trend in the market.