Synthetix (SNX/USD) Is Set to Claim the $2.500 Price Level
Estimated Reading Time: 3 minutes
Don’t invest unless you’re prepared to lose all the money you invest. This is a high-risk investment and you are unlikely to be protected if something goes wrong. Take 2 minutes to learn more
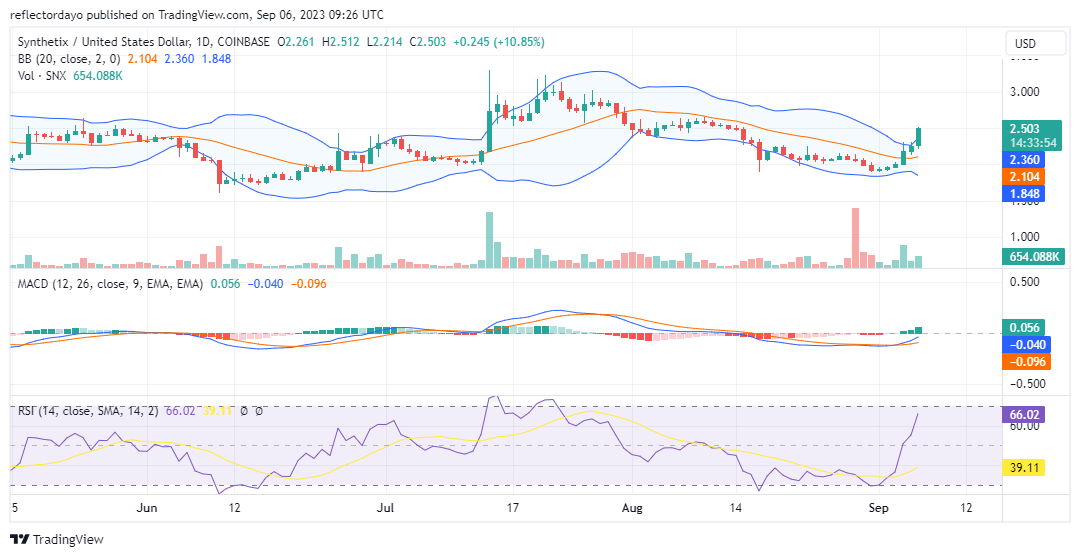
The $2.00 price level has proven to be a pivotal point in the Synthetix market since July 13th. This level marked a significant shift in market dynamics, leading to subsequent price movements. After a brief consolidation around $2.00, the price surged to a high of $3.312 before the bear market took control on August 14th. Following this, the price steadily declined throughout the remainder of July and the entire month of August, eventually dipping slightly below $2.00. However, this breach of the $2.00 support level acted as a trigger for a bullish reversal.
The bullish reversal gained momentum starting on September 4th, leading to the formation of three significant bullish candlesticks. Today’s candlestick has approached the $2.50 price level, signifying an upward push in the market.
Synthetix Market Data
- SNX/USD Price Now: $2.52
- SNX/USD Market Cap: $680,299,257
- SNX/USD Circulating Supply: 269,650,264 SNX
- SNX/USD Total Supply: 323,506,696 SNX
- SNX/USD CoinMarketCap Ranking: #48
Key Levels
- Resistance: $1200, $1300, and $1400
- Support: $1000, $900, and $800.
Price Prediction for Synthetix: The Indicators’ Point of View
The Bollinger Bands indicator provides insights into price volatility and potential trend changes. In recent days, the bullish price action has caused the bands to diverge. This divergence is primarily due to the sharp increase in price today. The upper standard deviation is now attempting to follow the bullish price action, which suggests that there might be further upside potential in the short term. Synthetix traders should keep a close watch on how the Bollinger Bands continue to react to price movements, as it can offer valuable clues about potential price reversals or breakouts.
The Relative Strength Index (RSI) is a momentum oscillator that measures the speed and change of price movements. A rising RSI indicates increasing bullish momentum. In this case, the RSI has shown a significant increase in momentum, rising from 29 to 64 over the past three days. This uptrend in RSI aligns with the recent bullish price action, confirming the strength of the current uptrend.
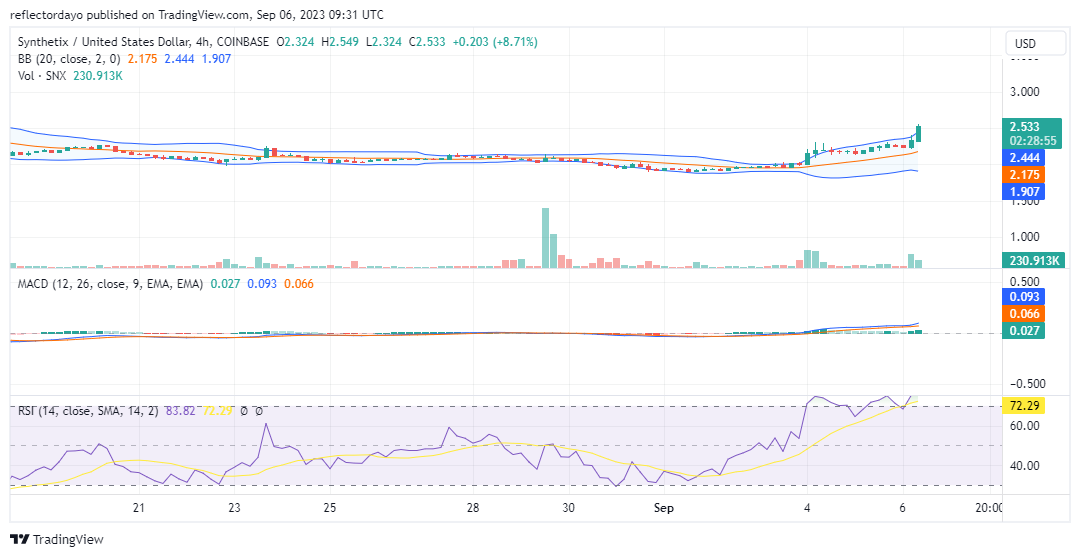
SNX/USD 4-Hour Chart Outlook
In this shorter timeframe, the market has already entered the overbought territory. If buying pressure persists, the market could remain overbought for an extended period before a correction occurs. The Bollinger Bands also indicate a bullish sentiment as they are currently forming an upward-trending price channel. However, as the price attempts to breach the crucial $2.500 level, there are signs of divergence in the standard deviation curves. This divergence may be attributed to potential contention between sellers and buyers at this level. If buyers successfully break through this price level, their next task would be to establish it as a support or demand level.