Synthetix (SNX/USD) Establishes a Pivotal Moment at the Historic $2.00 Support Zone
Estimated Reading Time: 2 minutes
Don’t invest unless you’re prepared to lose all the money you invest. This is a high-risk investment and you are unlikely to be protected if something goes wrong. Take 2 minutes to learn more
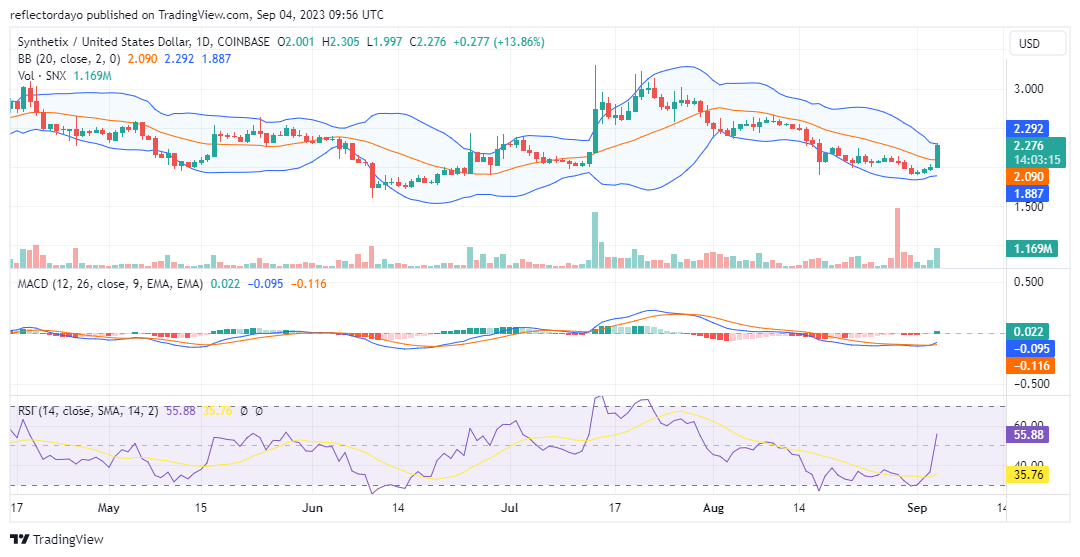
The $2.00 price level became crucial around mid-July when Synthetix buyers gathered around it to push the price above $3.00. The bear market started when the price reached a high of $3.275 on July 14, and since then, throughout August, it has gradually declined back to $2.00. Today’s market is dominated by bulls, raising the possibility of a pivot forming at the $2.00 level.
Synthetix Market Data
- SNX/USD Price Now: $2.259
- SNX/USD Market Cap: $610,819,880
- SNX/USD Circulating Supply: 269,530,256 SNX
- SNX/USD Total Supply: 323,506,696 SNX
- SNX/USD CoinMarketCap Ranking: #56
Key Levels
- Resistance: $8.00, $8.50, and $9.00.
- Support: $6.00, $5.50, and $5.00.
Price Prediction for Synthetix: The Indicators’ Point of View
It is quite likely that the Synthetix price could stage a rally towards $3.00, possibly pausing briefly around $2.500 as some traders may opt to lock in profits at that level. This likelihood of an upward market move is supported by the high trading volume observed today, which indicates increasing interest from traders entering long positions.
The Relative Strength Index (RSI) reflects an almost vertical ascent, underscoring the robustness of the bullish trend. The RSI has surged significantly from the oversold threshold into the bullish zone. However, a concern arises with such a rapid surge, as some traders may be inclined to capitalize on their gains once the market reaches a critical price point.
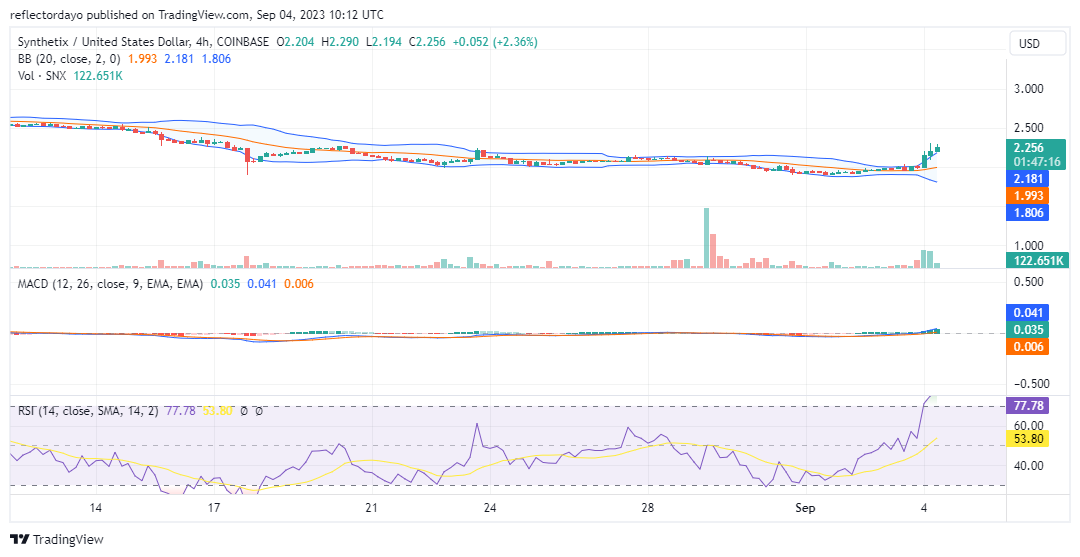
SNXUSD 4-Hour Chart Outlook
The 4-hour chart’s Relative Strength Index (RSI) currently indicates that Synthetix has entered the overbought region, emphasizing the strength of the buying momentum. If this buying momentum continues, it is possible that the market will remain in overbought territory for some time. However, it is crucial for the bulls to establish a higher support level to safeguard the progress they have made.