Uniswap (UNI/USD) Price Flutters Lightly Beneath the $6 Resistance
Estimated Reading Time: 3 minutes
Don’t invest unless you’re prepared to lose all the money you invest. This is a high-risk investment and you are unlikely to be protected if something goes wrong. Take 2 minutes to learn more

Free Crypto Signals Channel
UniswapPrice Prediction – May 26
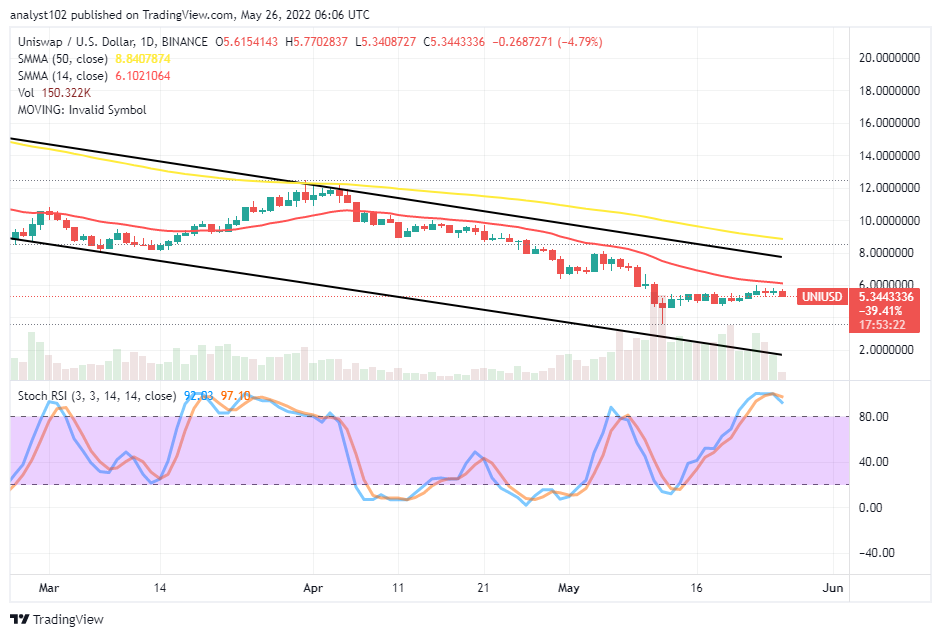
Running into several sessions until the present, the UNI/USD market price flutters lightly beneath the $6 resistant-trading line. The crypto’s worth is trading around the $5 value line at an average negative percentage rate of 4.79.
UNI/USD Market
Key Levels:
Resistance levels: $6, $8, $10
Support levels: $4, $3, $2
UNI/USD – Daily Chart
The UNI/USD daily chart showcases the crypto-economic price flutters lightly beneath the $6 resistance level for many days back, running into weeks now. The 14-day SMA indicator is below the 50-day SMA indicator with a separating space devoid of the presence of any trading candlestick. The Stochastic Oscillators are in the overbought region with a sign of trying to cross southbound within to indicate a falling pressure is imminent.
Can there be aggression in the UNI/USD market’s probable forthcoming falling motion?
There can be aggression in the UNI/USD market’s probable forthcoming falling motion if bulls tend to lose energy at a point while bears are gaining confidence to push for profiteering processes. In the meantime, it is technically ideal to wait for a correction to take a form to let long-position traders have a better outlook at a lower-trading zone that has to be borne by the reading of the Stochastic Oscillators before considering a buying order afterward.
On the downside of the technical analysis, the path of the downward-trending cycle has followed around the $6 resistance. And the 14-day SMA indicator has been seen a bit over it for a while. That affirms how crucial it is to breach northward to nullify the downward-trending move. The overall verdict suggests bears’ reactions around the resistance trading level may not suppress in the near time by that of bulls currently at that trading capacity point.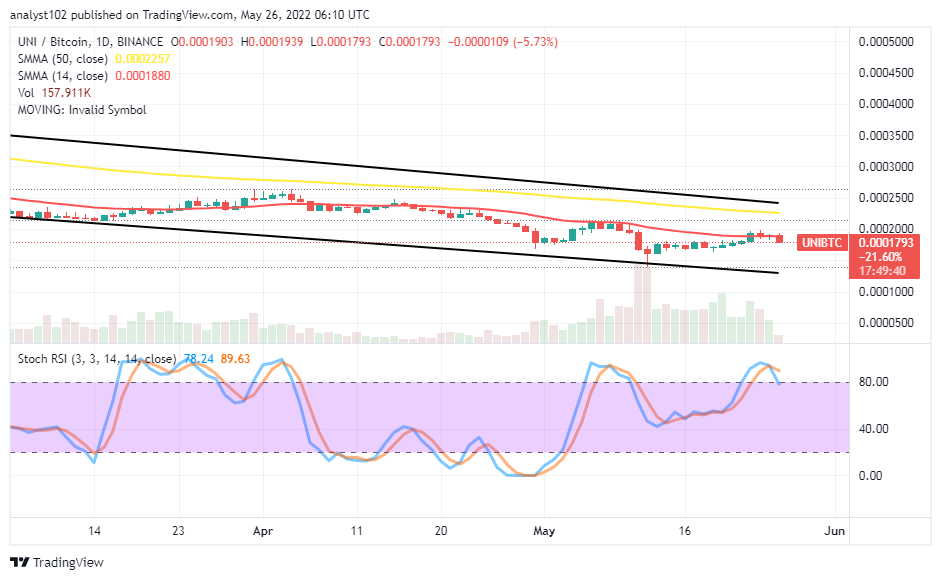
UNI/BTC Price Analysis
In comparison, Uniswap appears, giving in to a downward force, pairing with Bitcoin’s market pushing weight as showcased on the price analysis chart. The 14-day SMA indicator is underneath the 50-day SMA indicator. The bearish channels are to give an ascertained trending path of the trading of the pairing cryptos as their price flutters around the trend line of the smaller SMA. The Stochastic Oscillators are in the overbought region, trying to cross southbound against the 80 range. It means the base trading crypto is on the verge of losing position to the counter trending crypto.
Note: Cryptosignals.org is not a financial advisor. Do your research before investing your funds in any financial asset or presented product or event. We are not responsible for your investing results.
“Lucky is up more than 50% today but still more than 430% from All-Time Highs!
The opportunity to bank BIG is now!
You can purchase Lucky Block here. Buy LBlock:

