The Storj Market (STORJ/USD) May Be Starting Another Bullish Cycle from the Historic $0.22
Estimated Reading Time: 3 minutes
Don’t invest unless you’re prepared to lose all the money you invest. This is a high-risk investment and you are unlikely to be protected if something goes wrong. Take 2 minutes to learn more
The $0.22 price level marks the starting point of the last bull run in June. Prior to the rally, the Storj market had declined from around $0.30 to $0.22. At this juncture in the market, bullish momentum gathered, propelling the market upwards in a short period, reaching a peak of $0.58.
As the Storj bear market took hold at its peak, the initial support level for the market was $0.30. However, in mid-August, the market retraced back to the $0.22 price level, even testing the $0.20 mark on August 17 before the bearish pressure was countered, maintaining the critical support level at $0.22.
Storj Market Data
- STORJ/USD Price Now: $0.254
- STORJ/USD Market Cap: $100,243,623
- STORJ/USD Circulating Supply: 387,445,110 STORJ
- STORJ/USD Total Supply: 424,999,998 STORJ
- STORJ/USD CoinMarketCap Ranking: #185
Key Levels
- Resistance: $0.30, $0.35, and $0.40.
- Support: $0.25, $0.20, and $0.15.
Price Prediction for the Storj Market: The Indicators’ Point of View
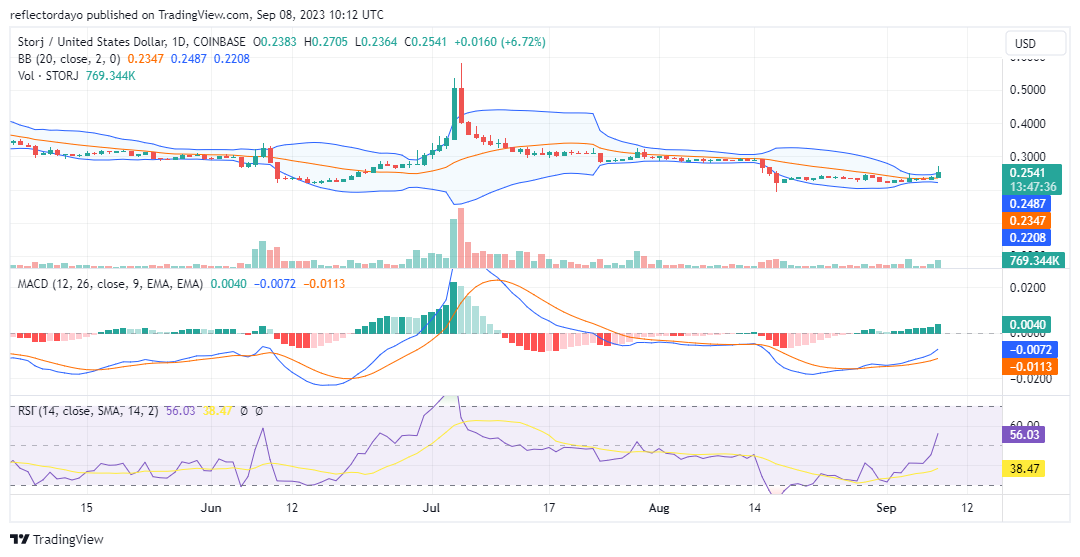
After the ambitious bear market was rejected and the price corrected back to the crucial $0.22 support level, the Storj market action entered a period of indecision. Consequently, the Bollinger Bands began to signal a decrease in volatility. The strong bearish movement in mid-August, followed by a sharp price correction from oversold conditions, led to heightened volatility. However, it’s worth noting that there have been noticeable spikes in liquidity levels in the bull market since the beginning of September.
As the bull market gains momentum and approaches the $0.30 price level, the Bollinger Bands exhibit divergence, and the Relative Strength Index (RSI) indicates a rise in momentum from 40 to 55 between September 6 and 8. Traders should remain vigilant and consider potential long trade opportunities.
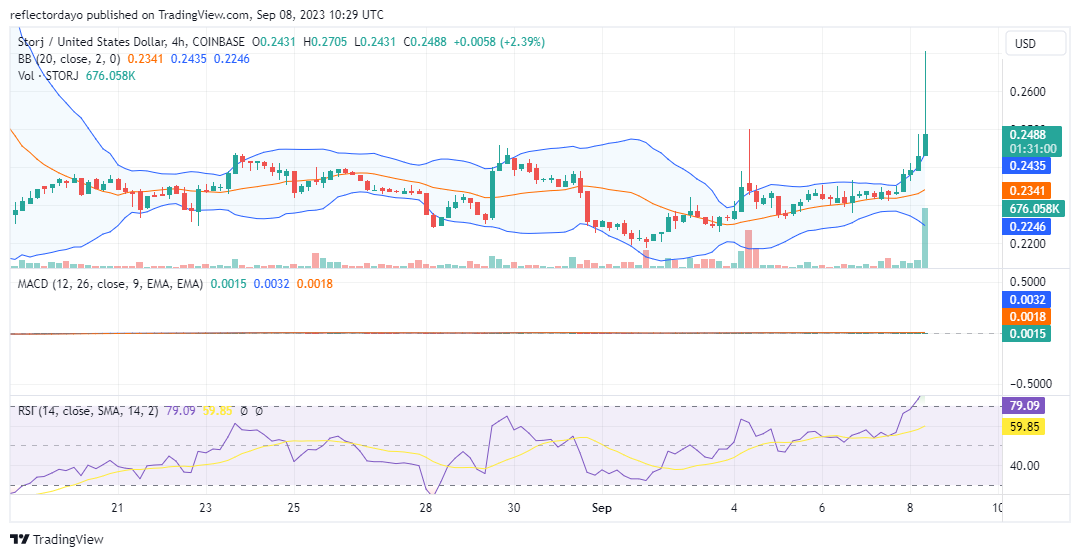
STORJ/USD 4-Hour Chart Outlook
In the third 4-hour session, we observe the formation of an inverted hammer along with a substantial surge in trade volume, as indicated by the histogram. The appearance of an inverted hammer after a consolidation phase suggests the potential for a bullish reversal. This pattern signifies that, despite the preceding consolidation and potential market indecision, buyers were able to drive the price higher during the trading session, which is generally regarded as a positive development. Furthermore, the notable increase in trading volume accompanying the inverted hammer reinforces the bullish sentiment, as elevated volume often reflects heightened buying interest and trader commitment.
The next likely target for the bull run could be the $0.300 price level. Following a brief pause at this level and a successful breach, the bull market may set its sights on revisiting the high from July 5th, which marked the initiation of the bearish trend.