Apecoin (APE/USD) Assertive Bullish Momentum Disrupts the Prevalent Bearish Trend
Estimated Reading Time: 3 minutes
Don’t invest unless you’re prepared to lose all the money you invest. This is a high-risk investment and you are unlikely to be protected if something goes wrong. Take 2 minutes to learn more
The Apecoin bear market has persisted since the early months of 2023. This decline commenced following the year’s peak, which occurred at $6,400 amid the broader bull market that prevailed during that time. In September, the bearish trend led the market to approach the critical milestone of $1,000. Subsequently, the price began to consolidate, with traders displaying reluctance to participate below this level. As the month drew to a close, a sudden and substantial upward surge emerged within the market, raising the prospect of a potential shift towards a bullish trajectory.
Apecoin Market Data
- APE/USD Price Now: $1.246
- APE/USD Market Cap: $460,070,687
- APE/USD Circulating Supply: 368.593,750 APE
- APE/USD Total Supply: 1,000,000,000 APE
- APE/USD CoinMarketCap Ranking: #71
Key Levels
- Resistance: $1.500, $2.000, and $2.400.
- Support: $0.800, $0.750, and $0.700.
Price Prediction for Apecoin: The Indicators’ Point of View
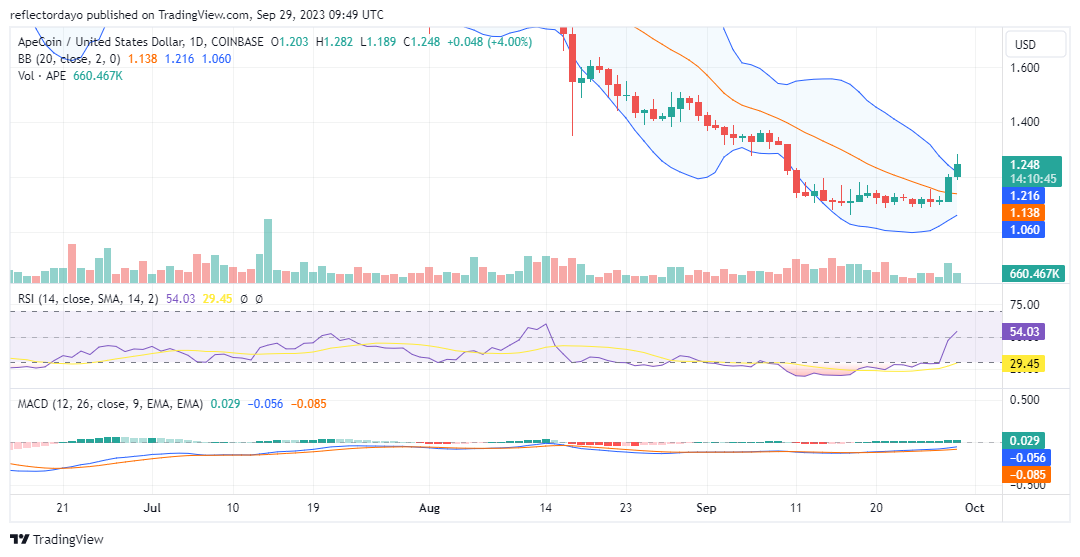
The prolonged bear market appeared to find a temporary pause around the $1.084 mark in mid-September. During this period, the Apecoin market exhibited a period of stagnation as supply and demand reached equilibrium. Despite heightened volatility, the market struggled to establish a clear trend, resulting in the Bollinger Bands expanding significantly. However, within the span of the most recent trading sessions, spanning from yesterday to today, a noteworthy shift towards an upward trajectory has emerged, leading to a convergence of the Bollinger Bands.
The recent bull run has been characterized by its remarkable strength and rapid ascent, propelling the price beyond the confines of the Bollinger Bands. As of now, the lower band is the sole indicator reflecting this new market development. Both the upper band and the 20-day moving average are in the process of adjusting to this abrupt shift in market conditions.
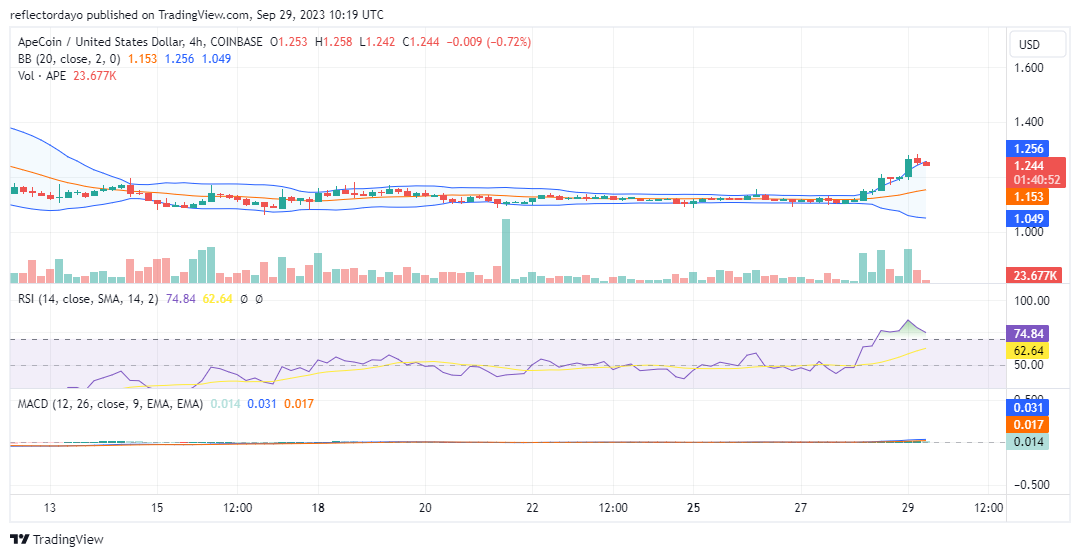
APE/USD 4-Hour Chart Outlook
From a 4-hour chart perspective, the rapid bullish surge swiftly propelled the market into overbought territory, as indicated by the Relative Strength Index (RSI). Consequently, the anticipation of a price correction arises. The robust bullish momentum, which expeditiously propelled the market into overbought conditions, appears to have bolstered bearish sentiment. Bears are seemingly establishing resistance prematurely, notably at the $1.272 level.
Presently, the foremost requirement for the bullish market is to establish a stronger support level in the vicinity of this price point. This strategic move is essential for sustaining the ongoing recovery, especially in light of the protracted dominance of bearish sentiment in recent times.