Binance Coin Breaks Above $430 Resistance, Uptrend Is Likely
Estimated Reading Time: 2 minutes
Don’t invest unless you’re prepared to lose all the money you invest. This is a high-risk investment and you are unlikely to be protected if something goes wrong. Take 2 minutes to learn more

Binance Coin (BNB) Long-Term Analysis: Bullish
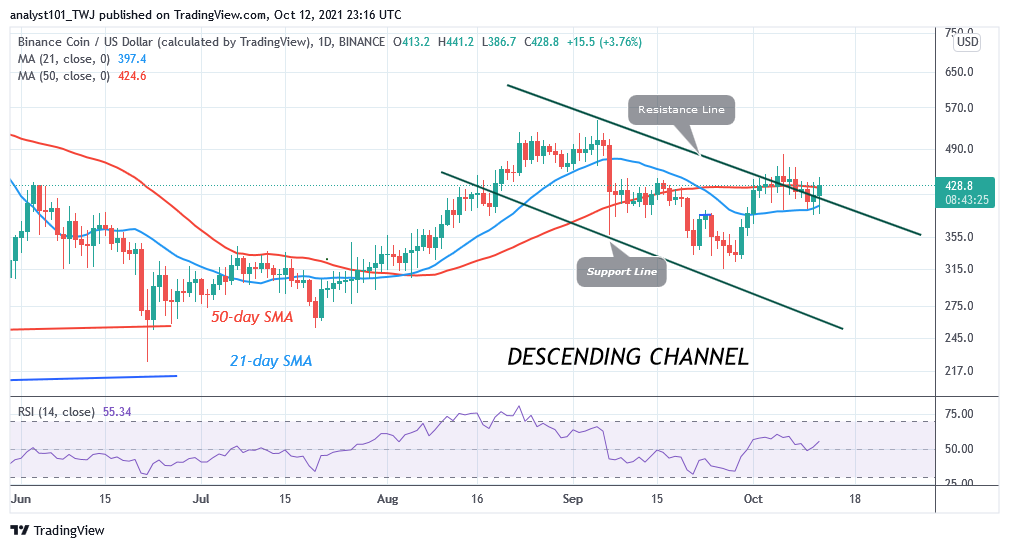
Binance Coin’s (BNB) price is above the 21-day SMA but below the 50-day SMA. The altcoin is attempting to break above the $430 resistance. In other words, the bulls are attempting to break above the 50-day SMA resistance. According to the RSI, BNB has room to rally on the upside. Nevertheless, if the current resistance is breached, BNB will rally to $450 high. However, the altcoin will face stiff resistance at the recent high.
Binance Coin (BNB) Indicator Analysis
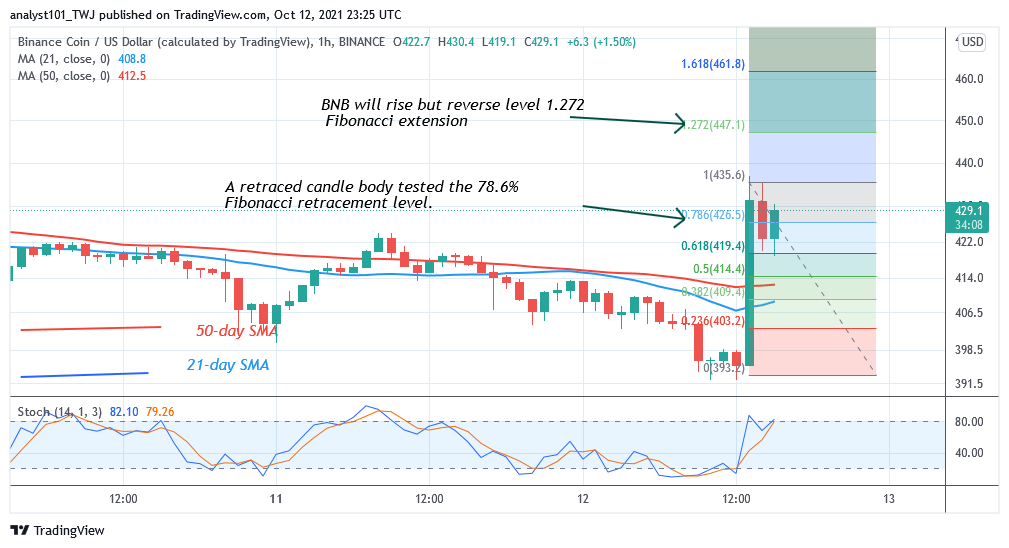
Binance Coin is at level 57 of the Relative Strength Index period 14. It indicates that the market is in the bullish trend zone and above the centerline 50. Also, crypto is capable of rising on the upside.BNB/USD is above the 80% range of the daily stochastic. It indicates that BNB is trading in the overbought region of the market. Also, the bullish pressure is reaching bullish exhaustion as sellers emerge.
Technical indicators:
Major Resistance Levels – $640, $660, $680
Major Support Levels – $540, $520, $500
What Is the Next Direction for Binance Coin (BNB)?
On the 4 –hour chart, the altcoin rebounded above the $390 support to reach a high of $436. The crypto is now fluctuating below the recent high. The uptrend will resume if price breaks above the resistance. However, crypto has reached the overbought region of the market. Meanwhile, on October 12 uptrend; a retraced candle body tested the 78.6% Fibonacci retracement level. The retracement indicates that BNB will rise but reverse at level 1.272 Fibonacci extension or level $447.10.
You can purchase crypto coins here. Buy Tokens
Note: Cryptosignals.org is not a financial advisor. Do your research before investing your funds in any financial asset or presented product or event. We are not responsible for your investing results