Chainlink (Link) Recovers, Attempts to Break Resistance at $30
Estimated Reading Time: 2 minutes
Don’t invest unless you’re prepared to lose all the money you invest. This is a high-risk investment and you are unlikely to be protected if something goes wrong. Take 2 minutes to learn more
Chainlink (LINK) Long-Term Analysis: Bullish
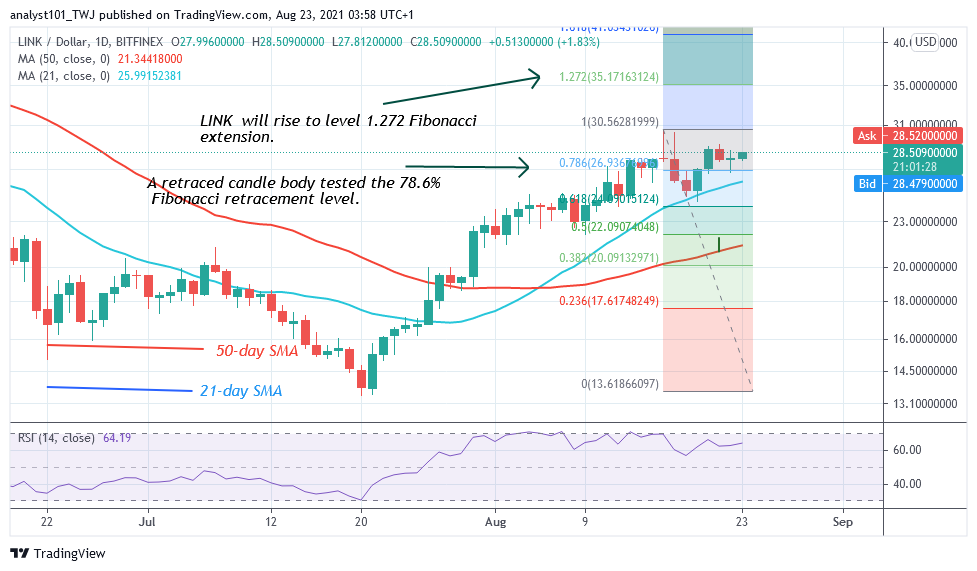
Chainlink (LINK) price is in a fresh uptrend as it reaches the high of $28.58. In the first uptrend, the market reached a high of $30.50 twice. The bulls could not sustain the bullish momentum above the recent high. Consequently, the crypto resumed a downward move to the low of $24.90. Today, buyers are pushing LINK price to retest or break the $30 resistance. Meanwhile, on August 16 upward, a retraced candle body tested the 78.6% Fibonacci retracement level. The retracement indicates that LINK price will rise but will reverse at level 1.272 Fibonacci level or level $35.17.
Chainlink (LINK) Indicator Analysis
LINK price has risen to level 64 of the Relative Strength Index period 14. It indicates that the crypto is in the uptrend zone and capable of rising on the upside. The coin has a bullish crossover. The 21-day SMA and the 50-day SMA are sloping upward indicating the upward move.
Technical indicators:
Major Resistance Levels – $40.00, $42.00, $44.00
Major Support Levels – $26.00, $24.00, $22.00
What Is the Next Direction for Chainlink (LINK)?
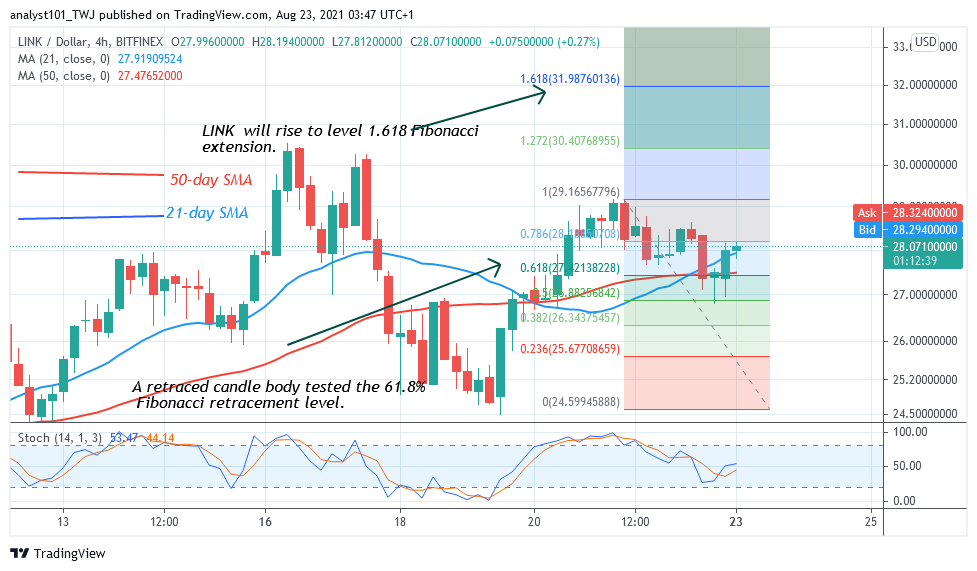
The chain link has resumed its upward move. Buyers are expected to breach the resistance at $29.15 and $30.50. The crypto is likely to reach a high of $32 if the resistances are cleared. Meanwhile, on the 4-hour chart, a retraced candle tested the 61.8% Fibonacci retracement level. It indicates that LINK will rise to level 1.618 Fibonacci extension or level $31.91.
You can purchase crypto coins here. Buy Token
Note: Cryptosignals.org is not a financial advisor. Do your research before investing your funds in any financial asset or presented product or event. We are not responsible for your investing result