SPONGE/USD ($SPONGE) Gathers Strength at $0.00033, Eyes Potential Breakout Beyond $0.00041
Estimated Reading Time: 3 minutes
Don’t invest unless you’re prepared to lose all the money you invest. This is a high-risk investment and you are unlikely to be protected if something goes wrong. Take 2 minutes to learn more
On November 14, a support level materialized at $0.00033, prompting an upward shift in the $SPONGE price momentum. Despite this positive movement, the bull market encountered resistance at the $0.00041 price level, hindering further upward progress. Consequently, a notable bearish correction ensued, potentially setting the stage for a bullish rebound at the $0.00033 price level. Investors are advised to monitor these developments closely for potential shifts in market dynamics.
Key Price Levels
- Resistance: $0.00023, $0.00028, and $0.0003.
- Support: $0.00012, $0.00011, and $0.00010.
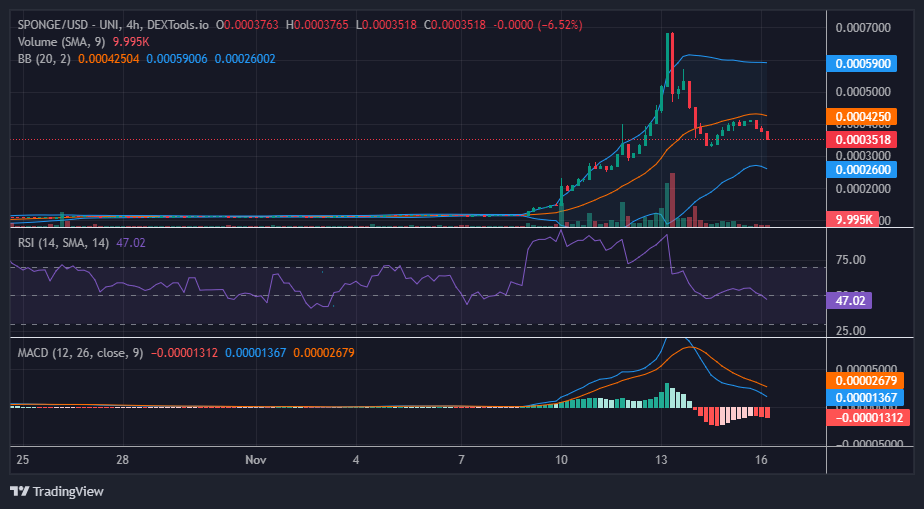
SPONGE/USD ($SPONGE) Price Analysis: Technical Insights
The Bollinger Bands, reflecting a considerable distance between standard deviations, indicate substantial volatility. However, the emergence of resistance at the $0.00041 price level and the establishment of $0.00033 as a support level may contribute to a dampening of volatility, leading the market to consolidate around these price levels. The Relative Strength Index (RSI) signals equilibrium between demand and supply, with neither bulls nor bears exhibiting noticeable strength.
In light of these factors, it is plausible to anticipate the formation of a support level that will sustain an upward trajectory in the market. $SPONGE investors are encouraged to closely monitor these technical indicators for potential insights into future market movements.
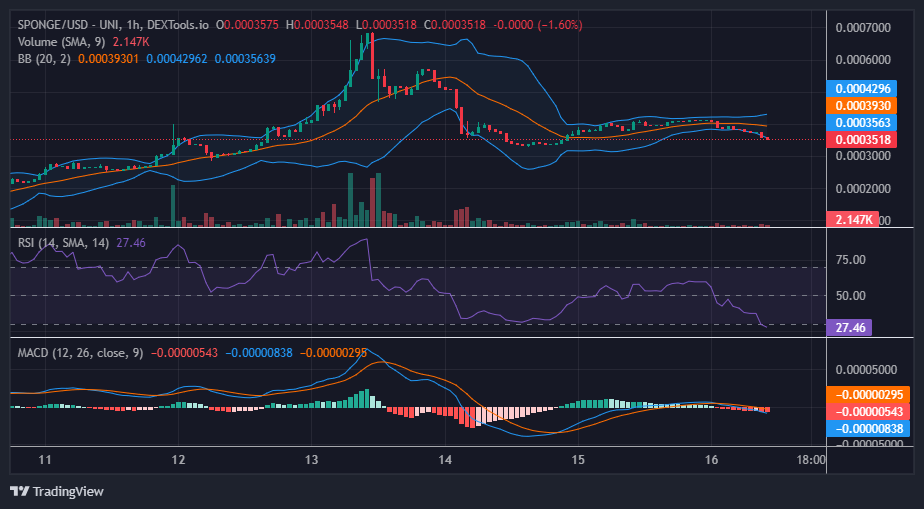
Short-Term Outlook: 1-Hour Chart
In the 1-hour chart analysis of the market, the Relative Strength Index (RSI) is indicating an oversold condition for the $SPONGE market, with the momentum recently crossing below the 30 level threshold. This observation may influence investor sentiment, prompting them to consider long positions. The expectation is that the market price will undergo a corrective movement from the oversold condition. When combined with prevailing bullish sentiment, this could lead to a notably significant bullish trend. Investors are advised to carefully evaluate these indicators when making trading decisions.
Buy SPONGE/USD!
🧽 $SPONGE is love, $SPONGE is life#MemeCoin #Trade #Web3 #Crypto pic.twitter.com/G0BsDjyqwW
— $SPONGE (@spongeoneth) November 11, 2023
Invest in the hottest and best meme coin. Buy Sponge ($SPONGE) today!