Sponge (SPONGE/USD) Investors Intervene at $0.0003350 to Sustain the Positive Market Momentum
Estimated Reading Time: 2 minutes
Don’t invest unless you’re prepared to lose all the money you invest. This is a high-risk investment and you are unlikely to be protected if something goes wrong. Take 2 minutes to learn more
In the preceding analysis, the SPONGE/USD bearish trend that started at the high of $0.0006 was anticipated to reach $0.0003, which was identified as the previous support level for the SPONGE/USD market. Nevertheless, investors intervened at a higher support level of $0.000335, aiming to propel the market toward higher price levels. However, the market is currently facing resistance at the $0.0004 level.
Key Price Levels
- Resistance: $0.0006, $0.00065, and $0.0007.
- Support: $0.00012, $0.00011, and $0.00010.
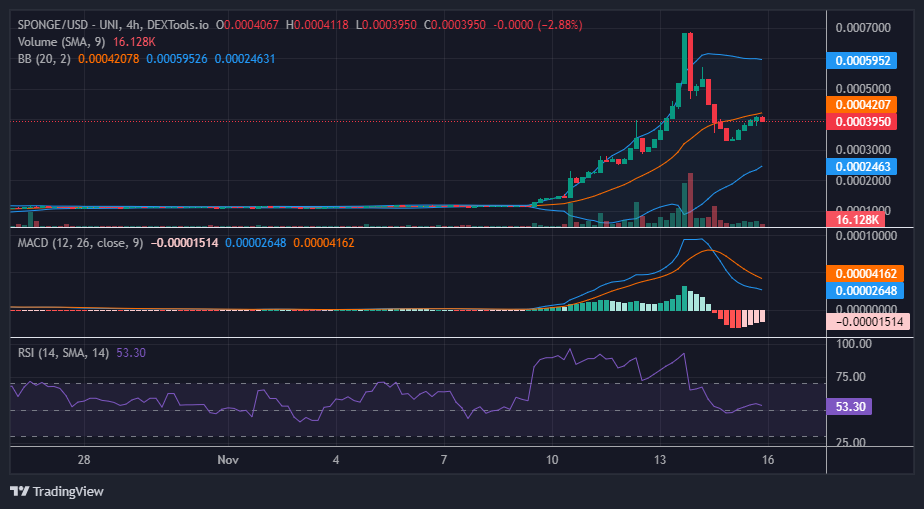
$SPONGE (SPONGE/USD) Price Analysis: Technical Insights
Upon examination of the trade volume indicator, it is evident that, despite the SPONGE/USD market’s upward trajectory, trade volume histograms have remained relatively low. This diminished trade volume poses a potential challenge for the bull market to surpass the $0.00040 price level. While the Moving Average Convergence and Divergence (MACD) indicator, with its faded red histograms, suggests a weakening bearish momentum, the market may consolidate around $0.0004. This consolidation could establish this level as a higher support level before the market resumes its upward trend.
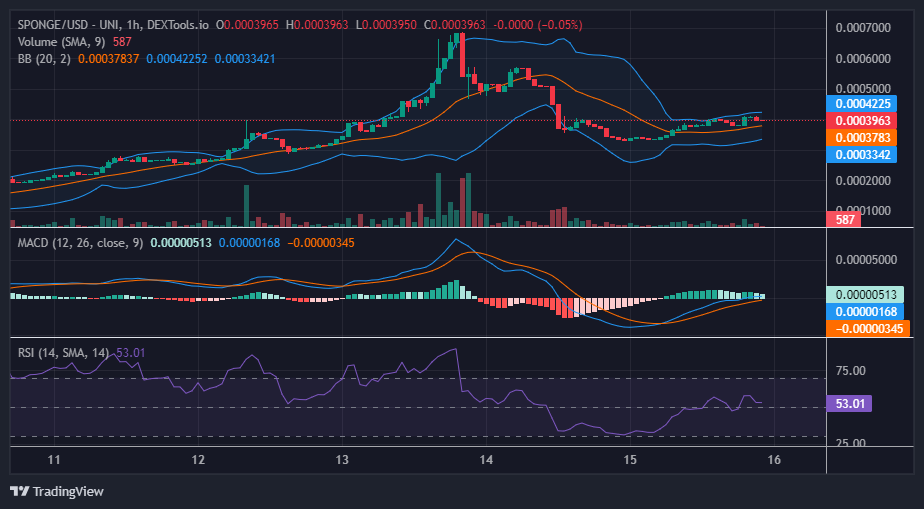
Short-Term Outlook: 1-Hour Chart
In the 1-hour chart analysis of the SPONGE/USD market, it is observed that the volume of trade indicator reflects diminishing trading activities through decreasing histograms. Concurrently, the price action exhibits sideways movement, consistently staying above the 20-day moving average. This indicates that, while volatility is currently limited, the bulls retain control over the market. This prevailing market dynamic suggests a gradual upward movement beyond the $0.0004 price level.
Buy SPONGE/USD!
Crypto bros is 2024 when they realise they missed the $SPONGE rocket 🚀🔥#MemeCoin #Web3 #Crypto #Alts pic.twitter.com/SvcrrUuHsU
— $SPONGE (@spongeoneth) November 13, 2023
Invest in the hottest and best meme coin. Buy Sponge ($SPONGE) today!