SPONGE/USD ($SPONGE) Endeavors Stability, Anticipating a Rebound at the $0.0003 Price Level
Estimated Reading Time: 2 minutes
Don’t invest unless you’re prepared to lose all the money you invest. This is a high-risk investment and you are unlikely to be protected if something goes wrong. Take 2 minutes to learn more

In the prior analysis of $SPONGE, there was speculation that the price would reach the $0.0006 level. As anticipated, the market indeed touched the $0.0006 level and even extended to $0.0007 before a bearish market sentiment triggered, resulting in a notable reduction of the bullish position. The $0.0003 level is strongly positioned to serve as a support level, potentially acting as a point of price recovery.
Key Price Levels
- Resistance: $0.0006, $0.00065, and $0.0007.
- Support: $0.00012, $0.00011, and $0.00010.
$SPONGE (SPONGE/USD) Price Analysis: Technical Insights
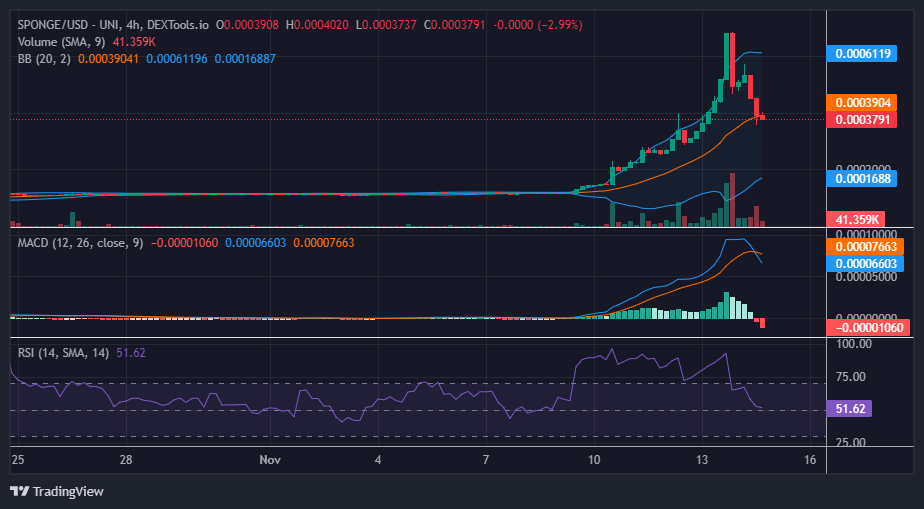
The $SPONGE price has recently broken the $0.0004 level, with indications that bulls are resisting a further decline. The current bearish candle implies a competitive struggle between bears and bulls at this level, raising the possibility of a support formation around $0.0004. However, it is crucial to note that the Moving Average Convergence and Divergence (MACD) indicator portrays significant bearish momentum through its negative histogram. Despite this, the most recent candlestick signals market indecision. As a result, there is a heightened likelihood of price rebounding in the vicinity of the $0.0004 level.
Short-Term Outlook: 1-Hour Chart
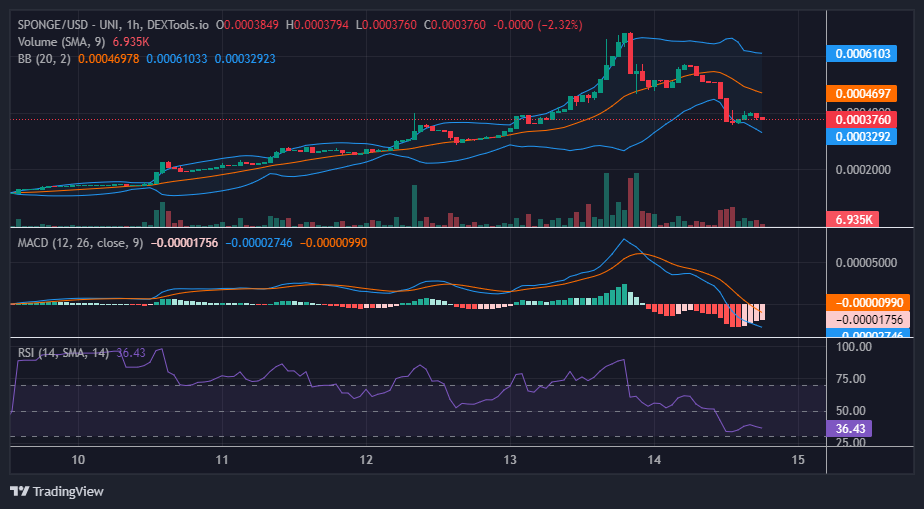
Upon examining the 1-hour chart perspective of the market, a robust resistance is evident, coalescing around the $0.00038 price level. Should the price persist in a sideways movement in this region, it is anticipated that the Bollinger Bands will converge around the $0.0004 price level. This convergence has the potential to fortify this level as a significant price point, potentially serving as pivotal support for a potential rebound.
Buy the Sponge meme coin today.
Crypto bros is 2024 when they realise they missed the $SPONGE rocket 🚀🔥#MemeCoin #Web3 #Crypto #Alts pic.twitter.com/SvcrrUuHsU
— $SPONGE (@spongeoneth) November 13, 2023
Invest in the hottest and best meme coin. Buy Sponge ($SPONGE) today!