$SPONGE (SPONGE/USD) Anticipated to Establish Crucial Support at $0.000200
Estimated Reading Time: 3 minutes
Don’t invest unless you’re prepared to lose all the money you invest. This is a high-risk investment and you are unlikely to be protected if something goes wrong. Take 2 minutes to learn more

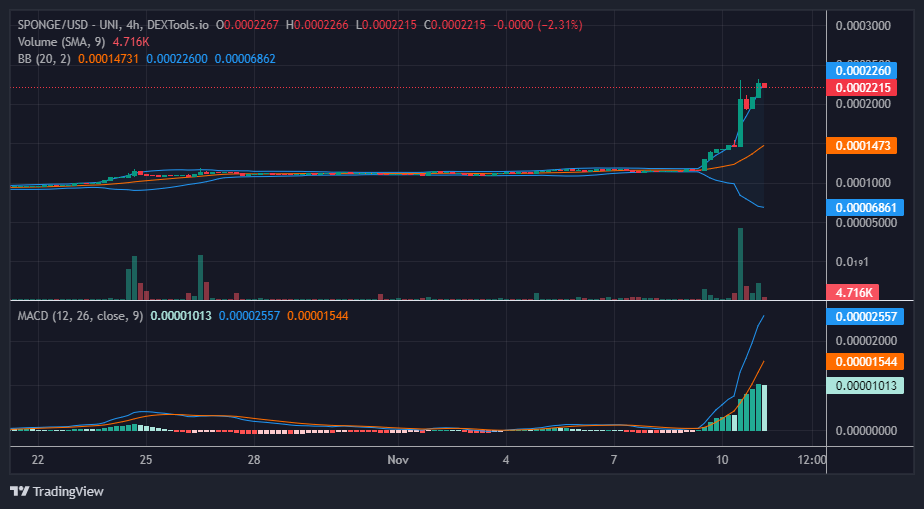
The resilient $SPONGE bullish trend seems to have encountered resistance at the $0.0002318 level. A concentration of sell orders around this threshold appears to be initiating a bearish market dynamic at the $0.0002318 price level. Despite this, the bearish momentum does not exhibit considerable strength, as indicated by the most recent bearish candle on the chart.
Typically, a robust bullish movement of this nature would be anticipated to prompt a significant bearish response; however, the current bear market has not manifested as aggressively as initially expected. The prevailing sentiment remains predominantly bullish. Nevertheless, it is noteworthy that the ongoing market downturn may find potential support at the $0.0002 price level.
Key Price Levels
- Resistance: $0.00023, $0.00028, and $0.0003.
- Support: $0.00012, $0.00011, and $0.00010.
$SPONGE (SPONGE/USD) Price Analysis: Technical Insights
The $0.0002 price level is potentially a support level; however, the decrease in trade volume, as evidenced by the diminishing histogram height of the Volume of Trade indicator, suggests that any retracement to the $0.0002 level may unfold gradually. Concurrently, the Bollinger Bands exhibit a wide divergence in the standard deviation curves, indicating heightened volatility. Despite the potential for a strong bearish response, the $SPONGE market continues to signal a high level of volatility, as per the Bollinger Bands.
Should the $0.0002 price level fail to provide support, there is a possibility that the $0.00014 level could act as a supportive barrier to maintain the bullish market stance. This is particularly plausible considering the brief sideways price range observed at the $0.00014 level.
Short-Term Outlook: 1-Hour Chart
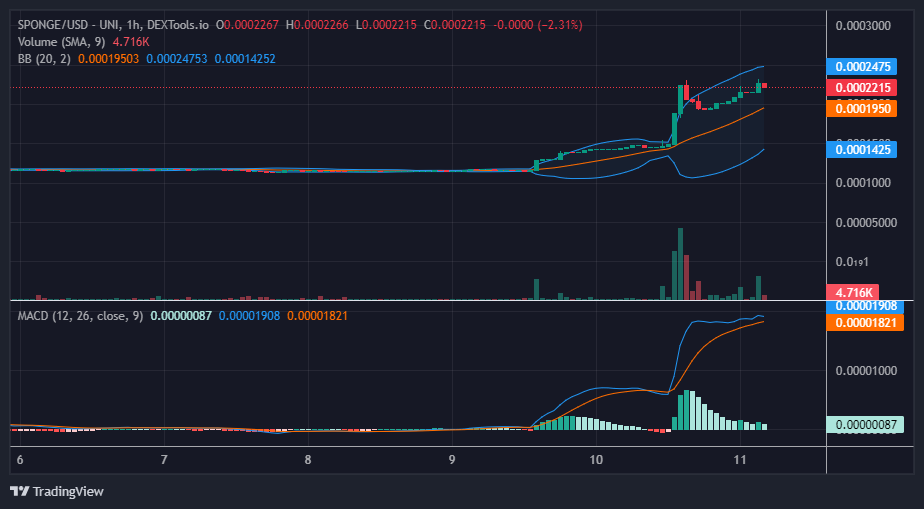
Upon analysis of the 1-hour chart, it is evident that bullish sentiment may still be prevailing in the market. In this shorter time frame, the bulls intervened decisively, mitigating the bearish response to the robust bullish market. Notably, bullish traders entered the market at the $0.0001935 price level, successfully rallying the price back towards the $0.0002318 resistance level.
However, this upward momentum faced resistance at the $0.0002318 level, resulting in the formation of a narrow price channel indicative of a consolidation trend between the $0.0001935 and $0.0002318 price levels. During this consolidation phase, a robust support level is likely to materialize within this price zone, contributing to the overall upward trajectory of the market.
Buy $SPONGE today!
GM frens 🧽💛#SPONGE #Crypto #Web3 #Alts pic.twitter.com/9MBOeRv1HV
— $SPONGE (@spongeoneth) November 8, 2023
Invest in the hottest and best meme coin. Buy Sponge ($SPONGE) today!