Sponge (SPONGE/USD) Demonstrates Significant Surge, Approaching the $0.00020 Price Range
Estimated Reading Time: 3 minutes
Don’t invest unless you’re prepared to lose all the money you invest. This is a high-risk investment and you are unlikely to be protected if something goes wrong. Take 2 minutes to learn more
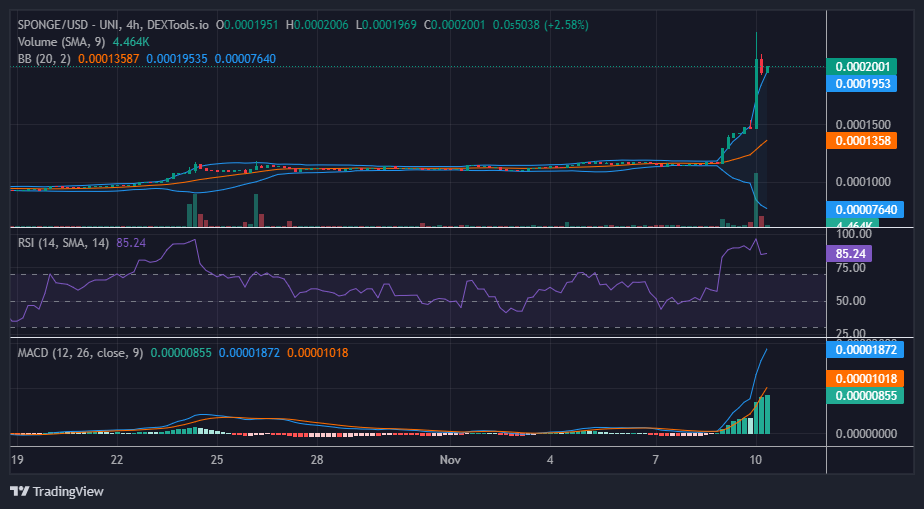
The SPONGE/USD market has exceeded our expectations, defying anticipated bearish sentiment upon entering the $0.00014 price zone. Despite initial concerns, the bull market experienced a substantial surge in liquidity, propelling it to the $0.0002 price level. This robust bullish movement triggered a significant retracement, with the hope that it will not fully negate the progress made by the bulls.
Key Price Levels
- Resistance: $0.00023, $0.00028, and $0.0003.
- Support: $0.00012, $0.00011, and $0.00010.
Sponge (SPONGE/USD) Price Analysis: Technical Insights
The current bullish price momentum is robust, potentially triggering substantial bearish sentiment. SPONGE/USD bullish traders are actively seeking a support level to serve as a pivot for the bull market, enabling them to establish a higher position and sustain the upward price trend. Analysis of the Bollinger Bands suggests that in the event of a bearish response, the impact could be significant. The ongoing bull run has led to a wide divergence of the Bollinger Bands, indicating a condition of heightened volatility that bears may exploit to undermine the bull market position.
However, an examination of the volume of trade indicator reveals a notable decline in histograms. This decline signals a reduction in volatility, hinting at the possibility of market consolidation at the $0.0002 price level.
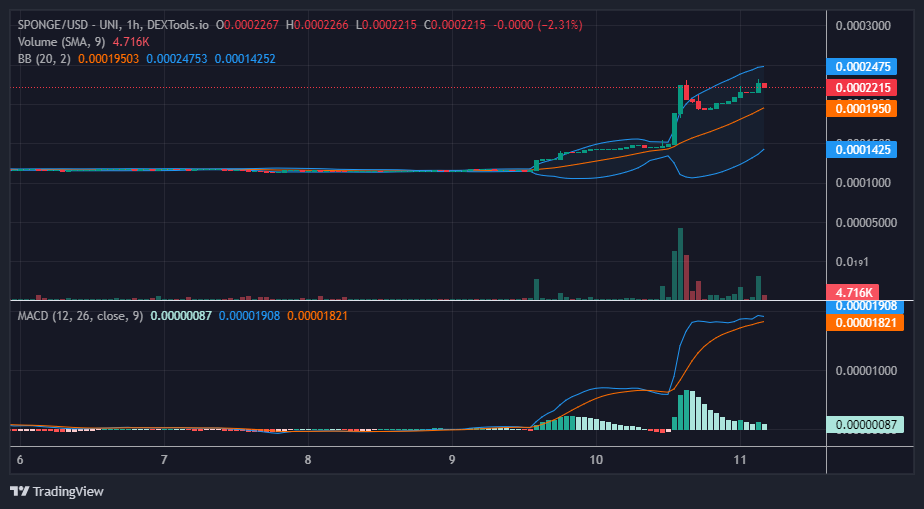
Short-Term Outlook: 1-Hour Chart
Upon examination of the 1-hour chart, it is evident that buyers are coalescing around the $0.0002 price level, actively working to mitigate the potential for a sharp decline in the market. The prevailing market sentiment appears to be bullish, suggesting a likelihood of the trend’s continuation. Analysis of the Bollinger Bands indicator reveals a pronounced bandwidth, yet both the two standard deviation curves and the 20-day moving average curve are exhibiting an upward trajectory. This aligns with a bullish market outlook, albeit one characterized by a notably high level of volatility.
Buy SPONGE/USD today!
**Cries is silence** 💦🧽#Web3 #Crypto #Altcoins #100x pic.twitter.com/DsMNo3RrvF
— $SPONGE (@spongeoneth) November 8, 2023
Invest in the hottest and best meme coin. Buy Sponge ($SPONGE) today!