Sponge (SPONGE/USD) Bulls Exhibit Strong Aggression, Driving Price Towards $0.00014
Estimated Reading Time: 3 minutes
Don’t invest unless you’re prepared to lose all the money you invest. This is a high-risk investment and you are unlikely to be protected if something goes wrong. Take 2 minutes to learn more
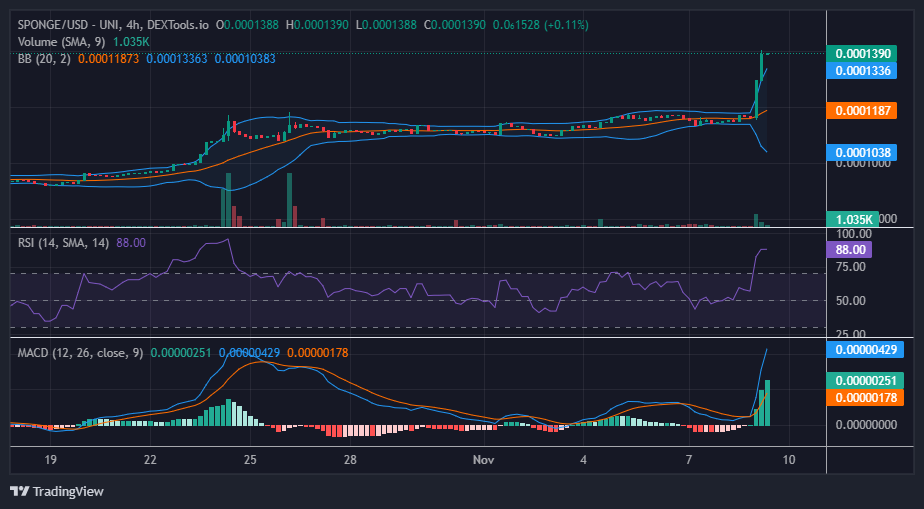
In the previous $SPONGE market analysis, there were speculations that emerged following the buyers’ intervention at the $0.0001136 price level, suggesting the potential for the price to surpass the $0.00012 threshold. These expectations were based on an assessment of the market’s recent performance over the past few weeks. November appears to favor bullish traders, as the market has been aligning with their interests since the beginning of the month. Today, the market has witnessed a substantial surge in the bull market, driving the price above the $0.000135 level, with $0.00014 well within reach for the bulls.
Key Price Levels
- Resistance: $0.000117, $0.000120, and $0.000125.
- Support: $0.000090, $0.000080, and $0.000085.
SPONGE/USD ($SPONGE) Price Analysis: Technical Insights
The significant surge in today’s $SPONGE trading session raises the possibility of an impending price correction. Nonetheless, bullish intervention at higher price levels could sustain the market’s upward trajectory. As anticipated, the trade volume indicator exhibits diminishing histogram heights, culminating in a doji candle within the most recent 4-hour trading session, indicating a market poised for a potential reversal. The Relative Strength Index (RSI) maintains consistent momentum around the 88 level, signifying an overbought market condition. This overbought signal may contribute to a price retracement. A plausible support level could materialize around the $0.00012 price range or, possibly, near the $0.0013 threshold.
Short-Term Outlook: 1-Hour Chart
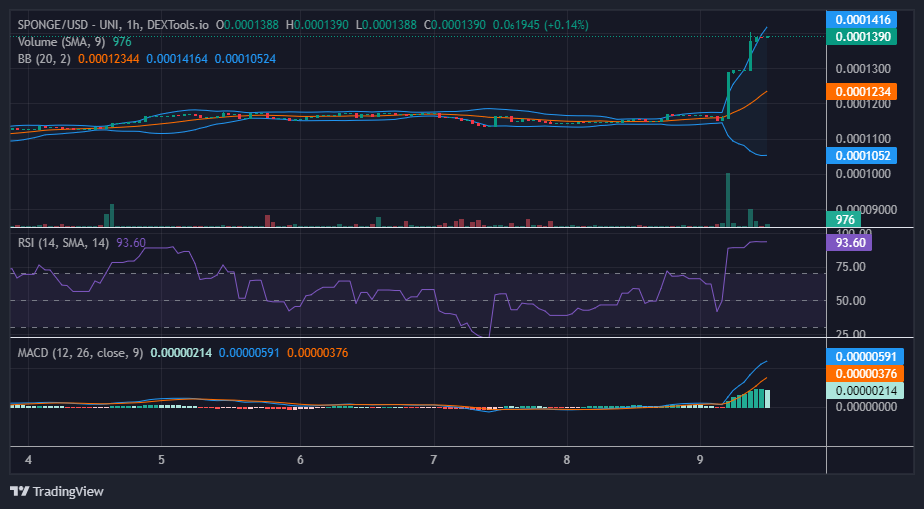
In the shorter timeframe, a notable equilibrium between supply and demand has materialized at the $0.000139 level, resulting in price stability at this point. The most recent histogram in the Moving Average Convergence and Divergence (MACD) has shifted towards a muted green shade, indicating waning bullish momentum and signaling a potential market decline. The $0.00013 price level appears to hold promise as a probable support level, with the potential to serve as a pivotal point for a market resurgence.
Buy SPONGE/USD today!
Crypto bros be like #SPONGE #MemeCoin #Alts #100x pic.twitter.com/Ws2lfadCRt
— $SPONGE (@spongeoneth) November 8, 2023
Invest in the hottest and best meme coin. Buy Sponge ($SPONGE) today!