Lucky Block Price Prediction: LBLOCK/USD Rebounds Once Again; Price Eyeing $0.000031
Estimated Reading Time: 3 minutes
Don’t invest unless you’re prepared to lose all the money you invest. This is a high-risk investment and you are unlikely to be protected if something goes wrong. Take 2 minutes to learn more
Lucky Block Price Prediction – October 24
The Lucky Block price prediction shows that LBLOCK battles the resistance at $0.000030 amid an impending breakout to a high.
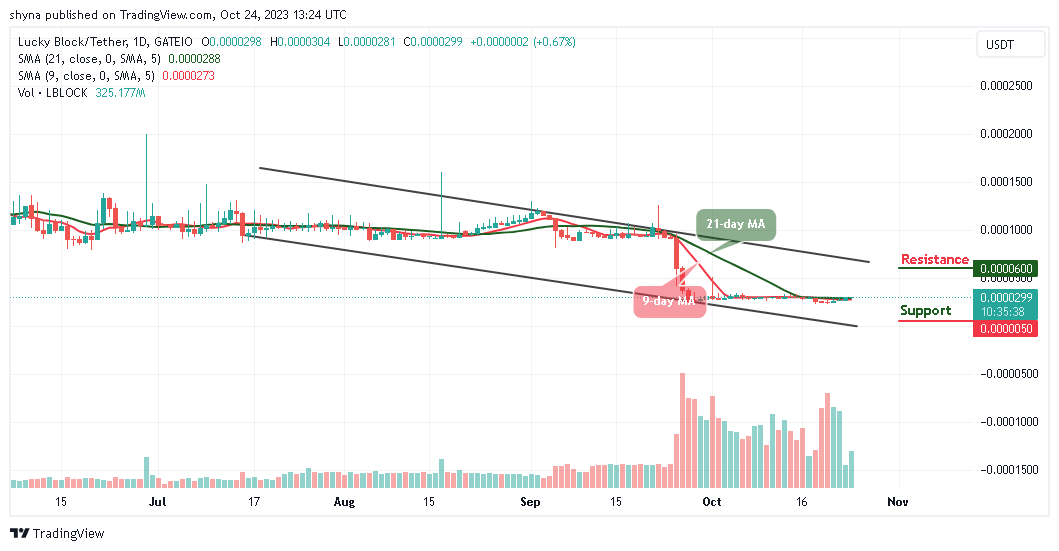
LBLOCK/USD Long-term Trend: Ranging (Daily Chart)
Key levels:
Resistance Levels: $0.000060, $0.000062, $0.000063
Support Levels: $0.000005, $0.000003, $0.000001
LBLOCK/USD is hovering around the $0.000029 level after touching the daily high of $0.000030. Meanwhile, the coin has not been able to climb the 9-day and 21-day moving averages as neither the bulls nor the bears are looking to hold the price by the scruff of its neck. All this may soon change. Moreover, the Lucky Block price will continue to go strong and point toward an upside breakout.
Lucky Block Price Prediction: LBLOCK Price Heads to the Upside
According to the daily chart, the Lucky Block price will spike to the upside to touch the nearest resistance level of $0.000035 if the bulls increase the pressure. However, it is more likely that LBLOCK/USD could extend the price action above the 9-day and 21-day moving averages as this will be a move that will call for more buy orders, increasing the price movement and pulling Lucky Block to new highs.
Nevertheless, for Lucky Block to be rejected at $0.000028 may eventually lead to declines below the moving averages. Should in case the coin drop below the lower boundary of the channel, then it could rely on the long-term support level at $0.000005, $0.000003, and $0.000001 but any further bullish movement to the upside could hit the potential resistance levels at $0.000060, $0.000062, and $0.000064.
LBLOCK/USD Medium-term Trend: Ranging (4H Chart)
The bullish candle on the 4-hour chart shows that the bulls are having their say in the market movement. As it stands now, the movement above the 9-day and 21-day moving averages shows that there is confidence and liquidity in bulls to take the Lucky Block price forward today. Moreover, it seems that the Lucky Block price prediction is approaching the bullish confirmation at the time of writing.
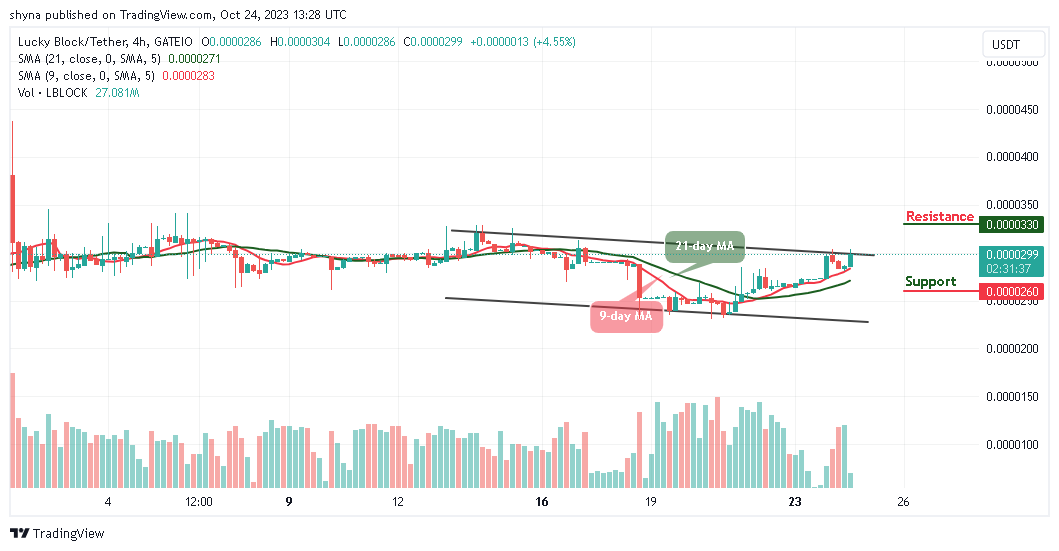
Meanwhile, if the current bullish move falters, profit booking may bring the price down toward the support level of $0.000026 and below. However, bulls could support the price above $0.000030 as they have done successfully in the past few days. But if the market price crosses above the upper boundary of the channel, it could reach the resistance level of $0.000033 and above.
You can purchase Lucky Block here. Buy LBLOCK