Lucky Block Price Prediction: LBLOCK/USD Price Consolidates Around $0.000025 Level
Estimated Reading Time: 3 minutes
Don’t invest unless you’re prepared to lose all the money you invest. This is a high-risk investment and you are unlikely to be protected if something goes wrong. Take 2 minutes to learn more
Lucky Block Price Prediction – October 20
The Lucky Block price prediction shows that LBLOCK continues trading sideways currently at $0.000025 after another significant rejection.
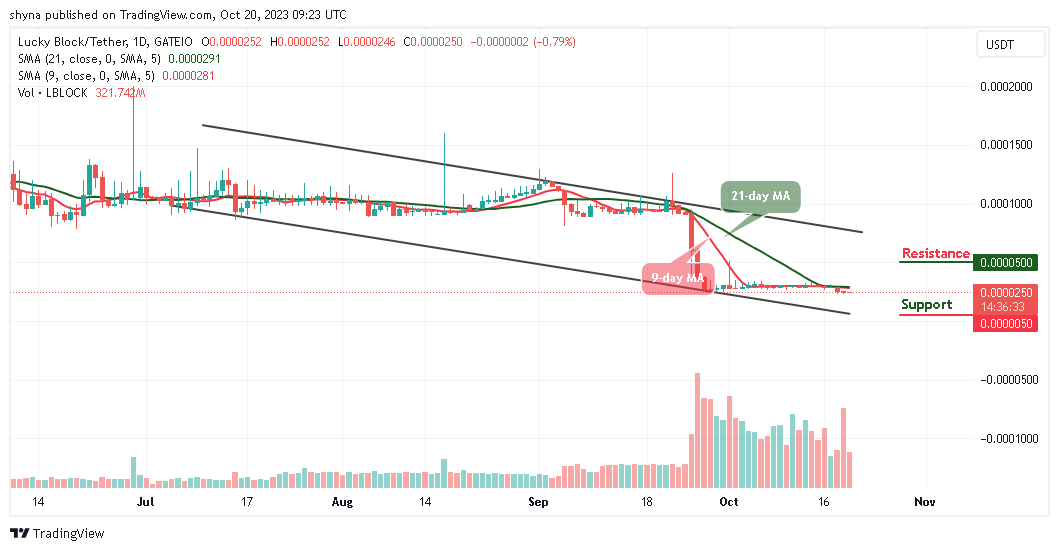
LBLOCK/USD Long-term Trend: Ranging (Daily Chart)
Key levels:
Resistance Levels: $0.000050, $0.000052, $0.000054
Support Levels: $0.000005, $0.000003, $0.000001
Looking at the daily chart, LBLOCK/USD is still flat and trading sideways but has seen a volatile move, aiming to cross above the 9-day and 21-day moving averages before quickly dropping to where it is trading currently. Therefore, one can say that the Lucky Block price is not recovering yet and may continue to trade sideways before heading to the upside.
Lucky Block Price Prediction: Would LBLOCK Price Continue to Stay in a Range?
The Lucky Block price is hovering at $0.000025 and displays an intraday loss of 0.79% as the coin keeps ranging from expanding volatility causing it to consolidate in a bearish flag pattern. Therefore, a breakout to the upside is supposed to continue in the direction of the previous trend. In this case, traders expect LBLOCK/USD to rise above 9-day and 21-day moving averages before heading toward the potential resistance levels at $0.000050, $0.000052, and $0.000054.
Moreover, should the Lucky Block price fail to cross above the moving averages; the price could drop below this barrier and may head toward the $0.000024 vital support. A further low drive could send the price to $0.000005, $0.000003, and $0.000001 support.
LBLOCK/USD Medium-term Trend: Ranging (4H Chart)
The 4-hour chart shows the bulls stepping back into the market. The Lucky Block price is currently attempting to cross above the 9-day moving average. Meanwhile, crossing below the lower boundary of the channel may drag the coin to the support level of $0.000021 and below.
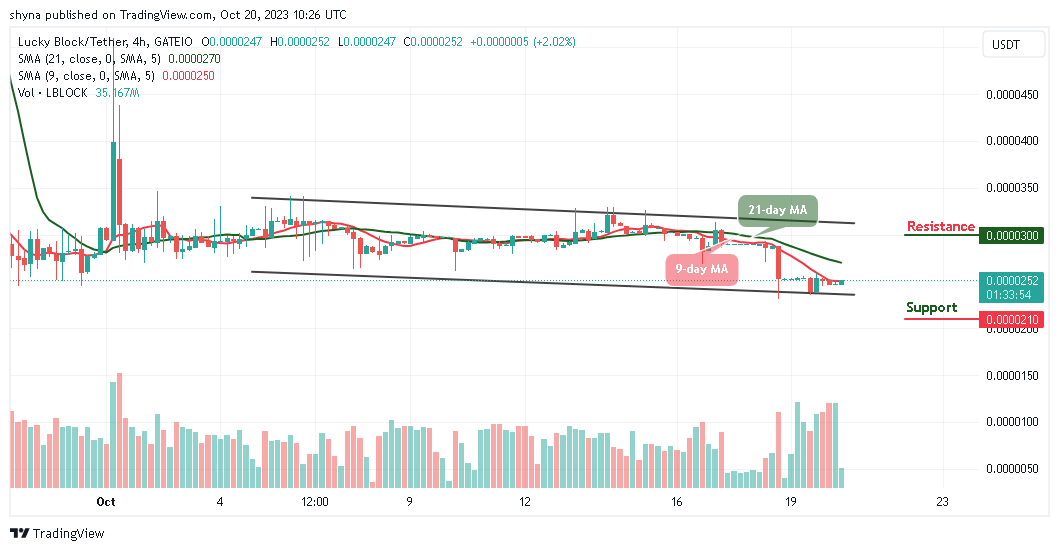
Nonetheless, if the buyers can regain strength and push the Lucky Block price to the north, traders may expect a push above the 21-day MA. Breaking this barrier may further allow the bulls to hit the resistance level of $0.000030 and above which may bring more bullish signals to the market.
You can purchase Lucky Block here. Buy LBLOCK