Polygon (MATIC/USD) Price Trades Below $1 Resistance
Estimated Reading Time: 3 minutes
Don’t invest unless you’re prepared to lose all the money you invest. This is a high-risk investment and you are unlikely to be protected if something goes wrong. Take 2 minutes to learn more

Free Crypto Signals Channel
Polygon Price Prediction – September 4
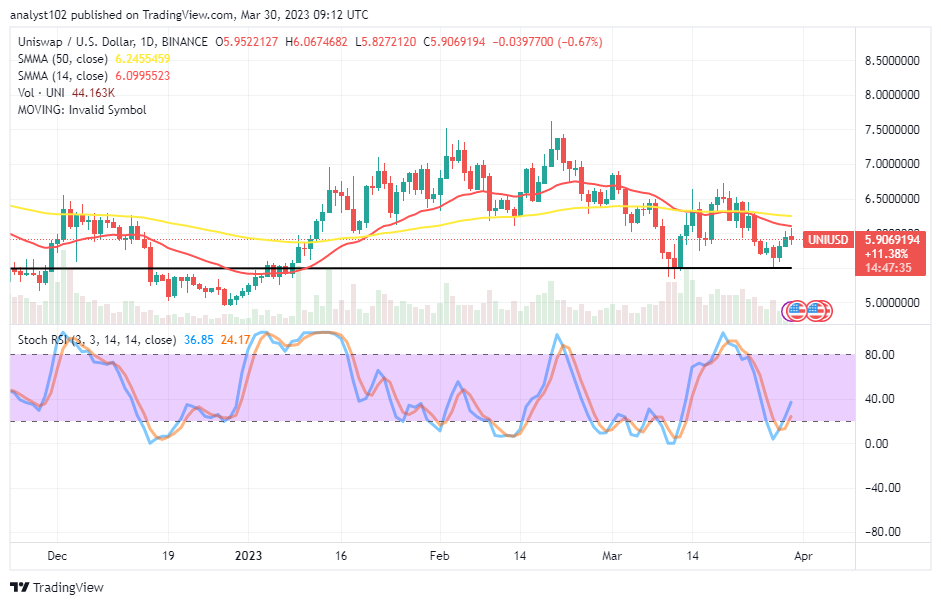
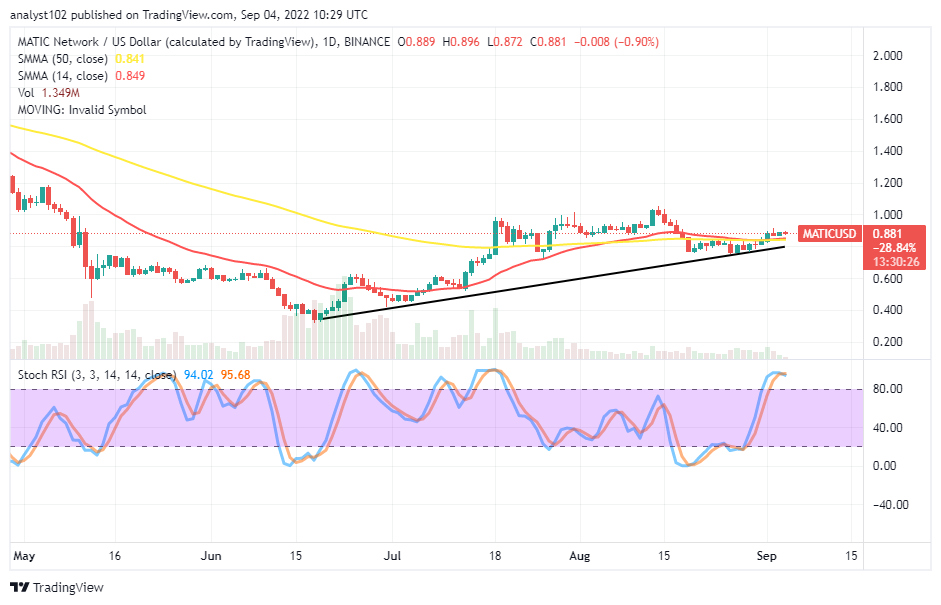
Buying pressure in the MATIC/USD market operations is weakening gradually as the crypto-economic price trades below the $1 resistance line. The last high-value line is $0.896 as it trades at $0.881, closely above the low point of $0.872 at a minute negative percentage rate of 0.90.
MATIC/USD Market
Key Levels
Resistance levels: $1, $1.10, $1.20
Support levels: $0.75, $0.65, $0.55
MATIC/USD – Daily Chart
The daily chart showcases the MATIC/USD market price trades below the $1 resistance level. In the fewer days, a series of smaller candlesticks have formed closely above the conjoined area of the SMAs. The bullish trend line drew northward below the SMA trend lines. To be precise, the 14-day SMA indicator is at $0.849 over the $0.841 value line of the 50-day SMA indicator. The Stochastic Oscillators are in the overbought region, keeping 94.02 and 95.68 ranges.
Will the MATIC/USD market go up and touch the $1 resistance line before resuming a genuine correction?
It may not necessarily be that the MATIC/USD market has to go up and touch the $1 resistance level before resuming a genuine correction, especially now that the crypto-economic price trades below the value line over a couple of days. At this point of trading capacity, the bull appears to lack the energy to push northward sustainably beyond the resistance value level. Briefly, it would be technically wise that long-position takers may take a break from launching new buying orders for now.
On the downside of the technical analysis, the trading situation of the MATIC/USD market operation has been relatively relaxing reliable forces to the upside at the moment. The overbought reading condition of the Stochastic Oscillators in the region suggests the gravitational force toward or through some resistances may intensely turn against the upholding of such a move to the north side. At this point, if traders are eager about going for a shorting order, a lower time frame such as 1-hour or the maximum shouldn’t exceed 4-hour to spot an entry before exerting a position.
MATIC/BTC Price Analysis
In comparison, on the price analysis chart, MATIC’s capacity to push further against Bitcoin has seemed to have exhausted to an extreme. The cryptocurrency pair price trades below the B0.00005 resistance level above the trend lines of the SMAs. The 14-day SMA is at B0.00004018 over the B0.00003501 value line. The Stochastic Oscillators are in the overbought region, showing 95.34 and 97.06 range values. It shows time is ripening for the counter-driven trading crypto to take the course against its base-trading crypto soon afterward.
Note: Cryptosignals.org is not a financial advisor. Do your research before investing your funds in any financial asset or presented product or event. We are not responsible for your investing results.
You can purchase Lucky Block here. Buy LBLOCK