Bitcoin Cash (BCH/USD) Market Swings at $500
Estimated Reading Time: 3 minutes
Don’t invest unless you’re prepared to lose all the money you invest. This is a high-risk investment and you are unlikely to be protected if something goes wrong. Take 2 minutes to learn more
Bitcoin Cash Price Prediction – July 9
The BCH/USD market swings at $500 slightly over a couple of several days’ sessions to denote that there is a kind of range-bound price movement in the crypto economy. Price possesses a smaller negative percentage rate of around 0.46 to trade at the level of $488 as of writing.
BCH/USD Market
Key Levels:
Resistance levels: $600, $800, $1,000
Support levels: $400, $300, $200
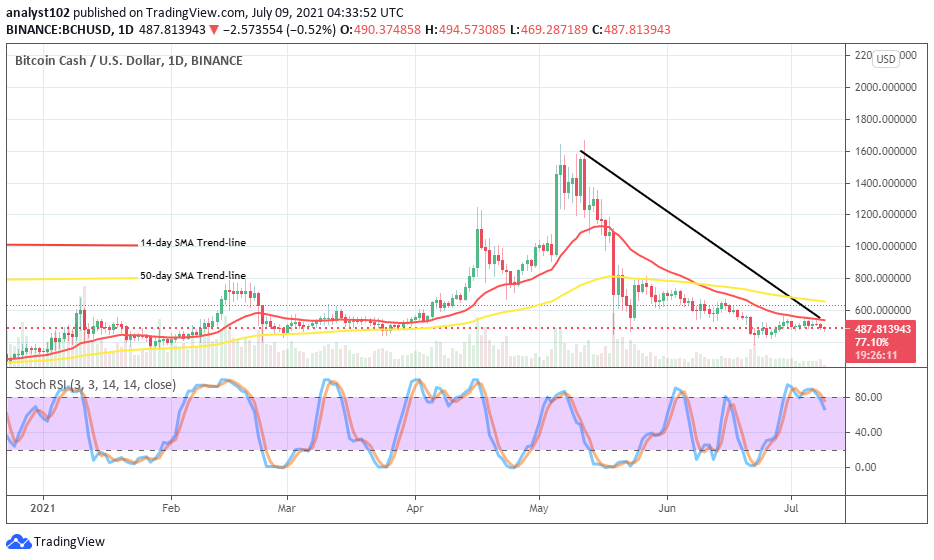
BCH/USD – Daily Chart
On the BCH/USD daily chart, it shows that the crypto market swings majorly in between the levels of $600 and $400 in the manner of range-bound moving outlook. The 14-day SMA trading indicator places resistance on top of the market’s featuring points as the bearish trend-line drew downward, touching the smaller SMA at the resistant zone underneath the 50-day SMA indicator. The Stochastic Oscillators have slightly crossed the lines southbound from the overbought region, suggesting that a depression is somewhat happening in the crypto-economic operations presently.
The BCH/USD market swings at $500; will there be a change of trend soon?
Changing of trend, not in the near time visible; in the trading activities of Bitcoin Cash pairing the US Dollar. To have a strong support baseline for the BCH/USD market bulls, a line of downward forces is necessary to surface following the readings of the Stochastic Oscillators coupled with the formation of candlesticks. And, the moment that the market comes up with a bullish candlestick from a dip, it would the better time that bulls re-launch their position in the crypto trade.
On the downside, the level around the resistance of $600 remains the better-off zone that the BCH/USD market bears should hold their position stronger against any subsequent up-rise that bulls may intend to pose back into the trade. However, a sudden hike against the point in question may allow the crypto worth to get projection into witnessing more series of up-risings in a bid of reverting into a bullish uptrend afterward.
BCH/BTC Price Analysis
Comparing the trending catalyst between Bitcoin Cash with Bitcoin, the BCH/BTC market swings faintly, creating a line of variant tiny-smaller lows close underneath the smaller SMA. All the indicators are close-located on the price analysis chart. The 14-day SMA trend-line is closely below the 50-day SMA indicator as the bearish trend-line drew southward to touch the smaller SMA. The Stochastic Oscillators are in the overbought region with conjoined lines, moving in a consolidation style to probably denote an indecision trading situation currently existing between the two cryptocurrencies. Therefore, it would be a better technical trading approach to be on the lookout for active price action before knowing which of the two cryptos will regain momentum.
Note: new.cryptosignals.org is not a financial advisor. Do your research before investing your funds in any financial asset or presented product or event. We are not responsible for your investing results.
You can purchase crypto coins here. Buy Tokens