Ripple (XRP) Is Trading in a Range but Might Fall as Low as $0.34
Estimated Reading Time: 2 minutes
Don’t invest unless you’re prepared to lose all the money you invest. This is a high-risk investment and you are unlikely to be protected if something goes wrong. Take 2 minutes to learn more
Ripple (XRP) Long-Term Analysis: Bullish
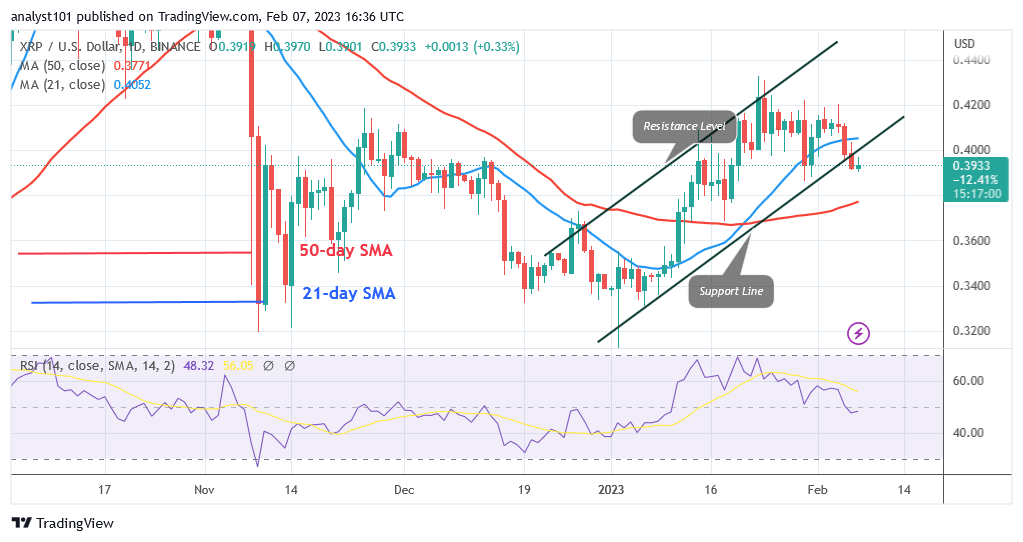
Ripple (XRP) price has fallen below the 21-day line SMA but might fall as low as $0.34. Since January 23, buyers have been unable to maintain a bullish trend above the $0.42 resistance level. The altcoin is currently trading between the moving average lines after a recent decline. As a result, XRP will keep declining until it reaches a low of $0.37. But the cryptocurrency will swing back and forth between the moving average lines. The price will restart its downward trend if it falls beneath the 50-day SMA on the downside. XRP will consequently fall to a low of $0.34. In contrast, XRP will resume its bullish trend if the price of the cryptocurrency increases above the 21-day moving average line. The coin will increase and retest.
Ripple (XRP) Indicator Analysis
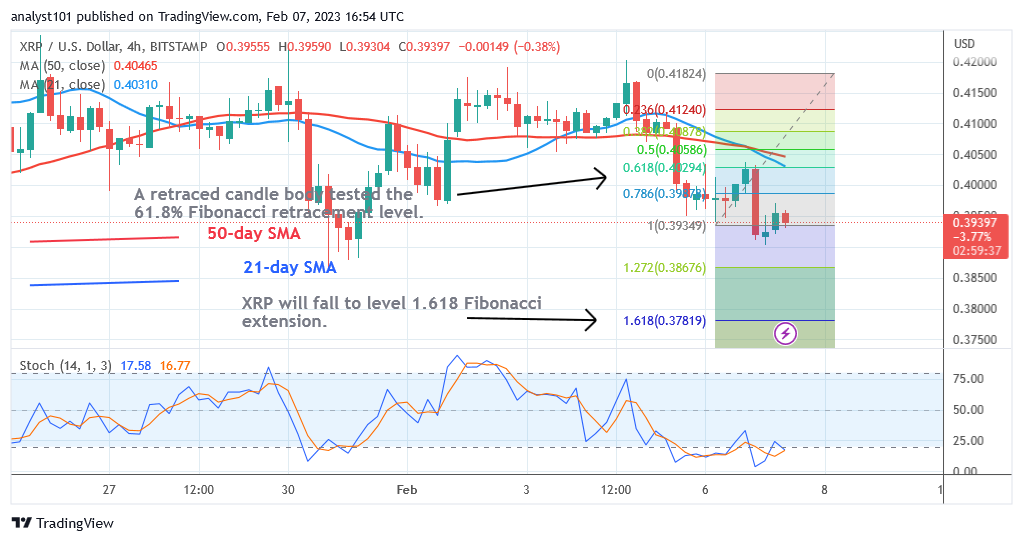
At level 49 of the Relative Strength Index for period 14, the altcoin is getting close to the bearish trend zone. Cryptocurrency demand and supply are balanced, maintaining market equilibrium. Ripple may start a range-bound motion as long as the price bars are positioned in between the moving average lines. XRP has fallen into the oversold region below the daily Stochastic’s threshold 20. The oversold area will see the emergence of buyers.
Technical indicators:
Major Resistance Levels – $2.00, $2.50, $3.00
Major Support Levels – $1.50, $1.00, $0.50
What Is the Next Direction for Ripple (XRP)?
Ripple has been stuck between the moving average lines but might fall as low as $0.34. The coin will presumably be forced to travel in a range bound pattern between the moving average lines, accor. When the moving average lines are crossed, the market will trend.
You can purchase crypto coins here. Buy LBLOCK
Note: Cryptosignals.org is not a financial advisor. Do your research before investing your funds in any financial asset or presented product or event. We are not responsible for your investing results