Polygon (POL) Price Prediction: POL Consolidates Above the $0.7200 Mark
Estimated Reading Time: 2 minutes
Don’t invest unless you’re prepared to lose all the money you invest. This is a high-risk investment and you are unlikely to be protected if something goes wrong. Take 2 minutes to learn more
Polygon (POL) Price Prediction: May 26
The Polygon market has managed to remain above the $0.7200 mark. However, the market hasn’t gathered much momentum beyond that level, with price action continuing to consolidate sideways. Currently, downward forces are threatening to push prices lower toward the $0.7200 mark, which is a technical support level.
POL/USDT Long-term Trend: Bearish (Daily Chart)
Resistance Levels: $0.7500, $0.8500, and $0.9500
Support Levels: $0.7200, $0.6200, and $0.5200
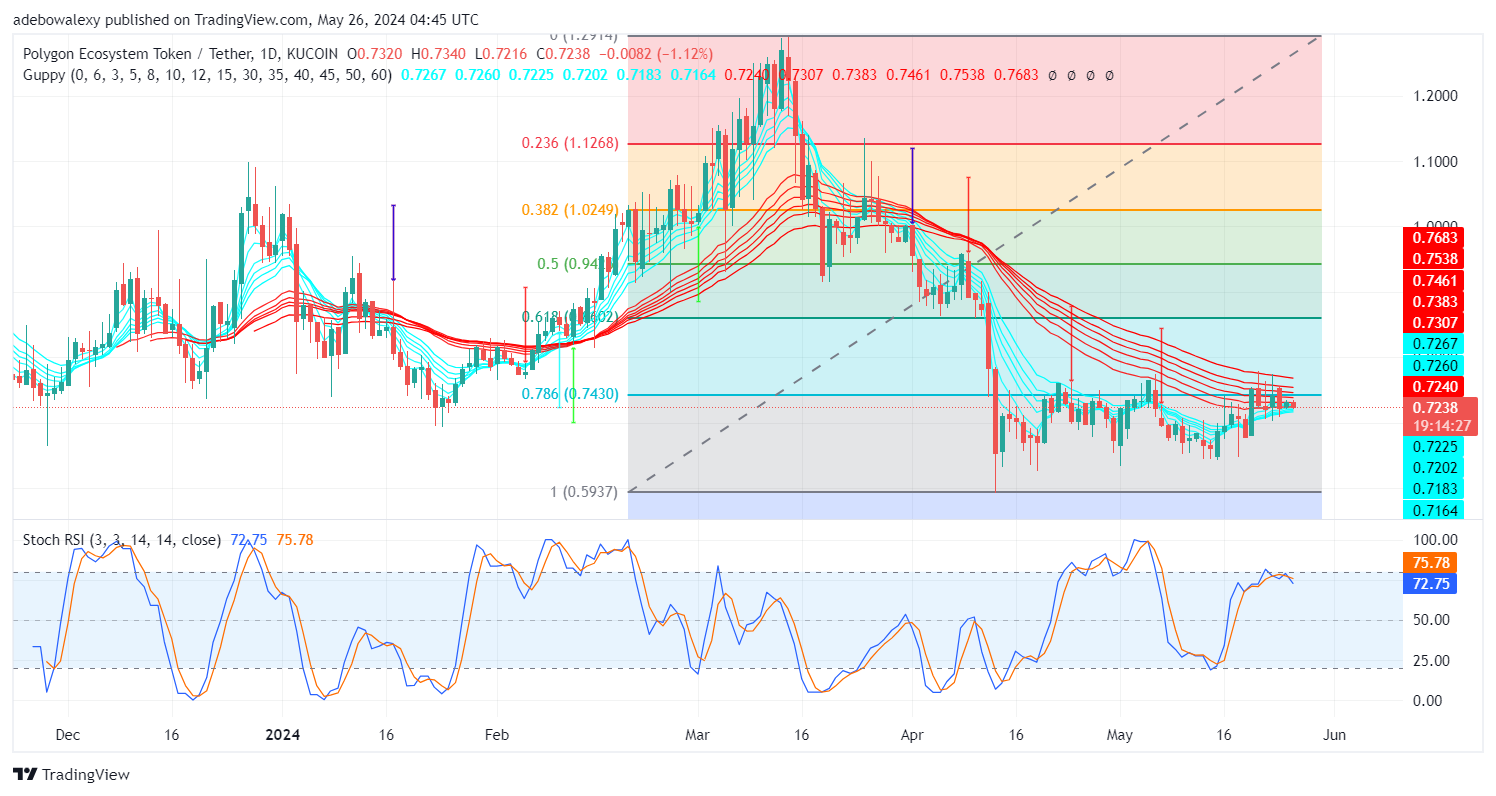
Recent price candles in the POLUSDT market are caught between the Guppy Multiple Moving Average (GMMA) lines, showing sideways movement. Additionally, the Stochastic Relative Strength Index (SRSI) lines are above the 70 mark but are oriented downward, indicating a bearish crossover.
Polygon Price Prediction: Will Headwinds Break the Technical Support at $0.7200?
Price action in the Polygon daily market has a bearish outlook. The latest price candle is red, indicating significant downward pressure. It is below more GMMA lines than it is above, strengthening the bearish stance and putting the market under significant pressure.
Additionally, the SRSI indicator lines have fallen below the 80 mark and have delivered a bearish crossover. This affirms the bearish tone, suggesting that price action may soon break below the $0.7200 mark.
POL/USDT Medium-term Trend: Polygon Bears Are Gaining Traction (4H Chart)
On the 4-hour price chart, the POLUSDT market shows a similar trend to the daily chart. The latest price candle is below more GMMA lines than it is above, but trading activities remain above the technical support at the $0.7200 mark.
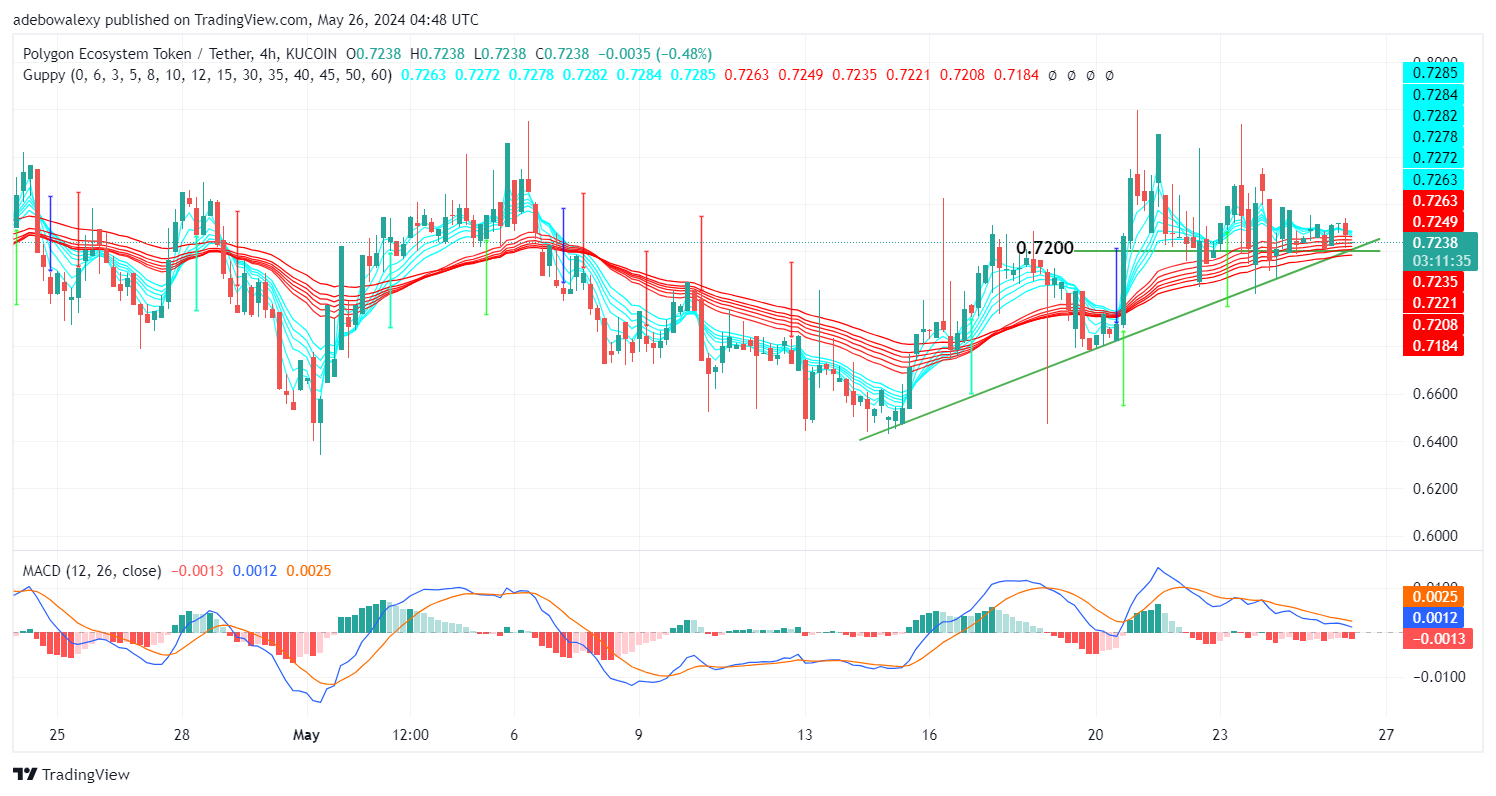
The Moving Average Convergence Divergence (MACD) indicator lines are falling toward the equilibrium level, and the MACD bars are solid red, highlighting the bearish tone of the market. As a result, traders should prepare for a possible drop to the $0.7200 mark as downward forces gain strength.