Fantom (FTMUSD) Now Ready to Claim Higher Price Levels
Estimated Reading Time: 2 minutes
Don’t invest unless you’re prepared to lose all the money you invest. This is a high-risk investment and you are unlikely to be protected if something goes wrong. Take 2 minutes to learn more
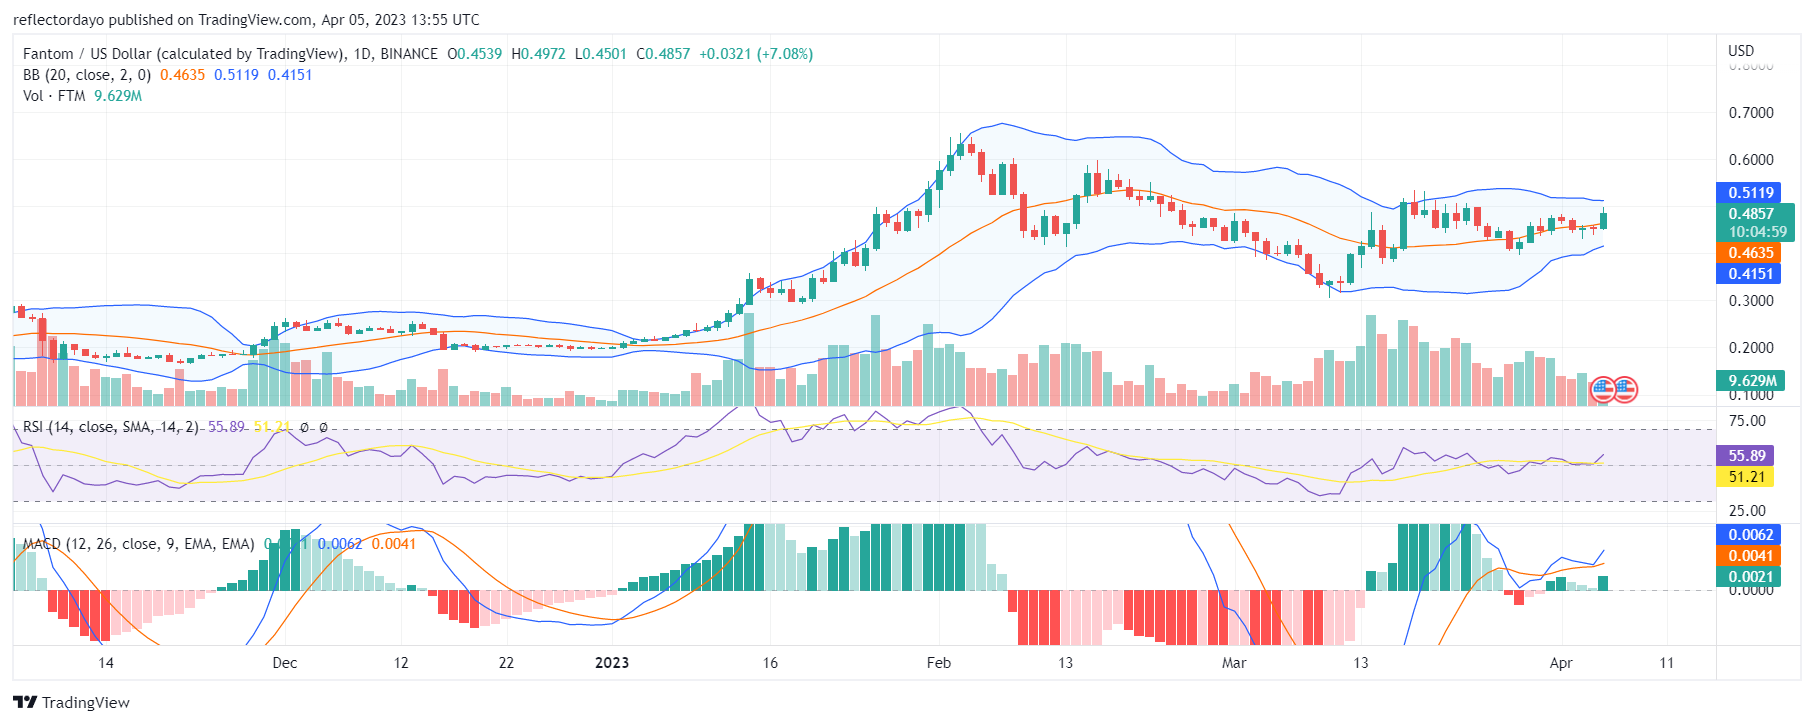
On March 14, a bullish price recovery brought the Fantom market out of the sell zone and settled the market at the point of equilibrium. On March 17, the price pumped furiously until the market reached the $0.5 price level. The bear market gathered momentum from this level to peg the progress of the bull market. Despite this, the bulls appear to still be on top of their game as they did not allow the price to decline. They found a strong support level at $0.406 to propel the market toward the key resistance level.
FTM/USD Price Statistics
- FTM/USD Price Now: $0.484
- FTM/USD Market Cap: $1,352,211,943
- FTM/USD Circulating Supply: 2,784,525,525 FTM
- FTM/USD Total Supply:3,175,000,000
- FTM/USD CoinMarketCap Ranking: #42
Key Levels
- Resistance: $0.6, $0.7, and $0.8
- Support: $0.4, $0.3, and $0.2.
Price Prediction for Fantom: The Indicators’ Point of View
After the rejection of the bullish price at the $0.5 price level, it took a while for the bulls to regain their balance under the pressure coming from the supply zone. That explains why the Bollinger Bands converge despite the strong bullish move in today’s market. It will take price action to break the $0.5 resistance level before the upper standard deviation line will join in a bullish way. If the bulls can sustain the market in the next daily session, the key resistance level will be captured.
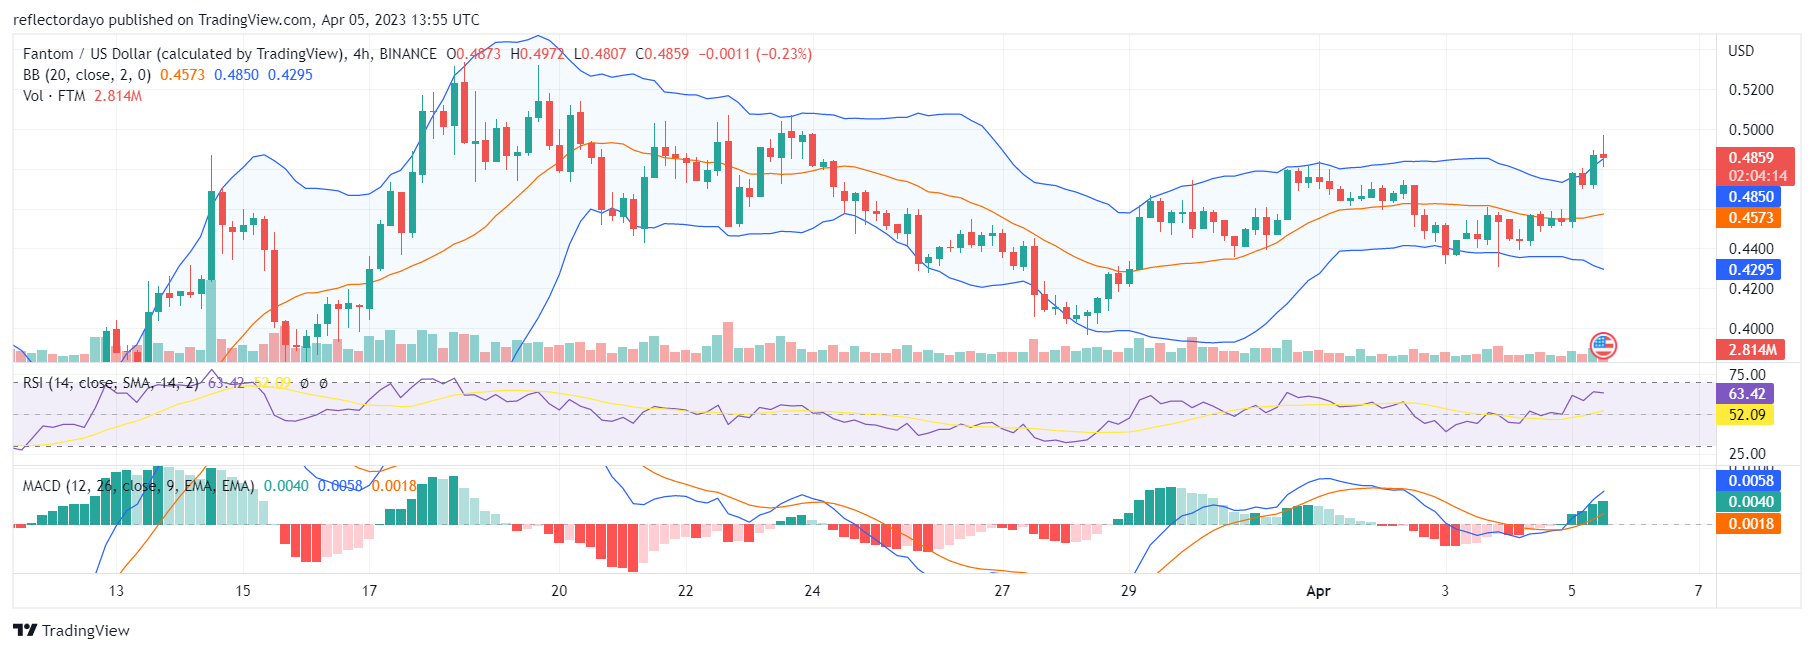
FTM/USD 4-Hour Chart Outlook:
The current 4-hour session has more activities on the side of buyers than on the side of sellers. However, none of them has been able to affect the price in either way. The market is experiencing very significant indecision at this time. But according to the indicators in the four-hour timeframe, the market is still going the bullish way.