Solana (SOL) Price Prediction: SOL Encounters Strong Headwind
Estimated Reading Time: 3 minutes
Don’t invest unless you’re prepared to lose all the money you invest. This is a high-risk investment and you are unlikely to be protected if something goes wrong. Take 2 minutes to learn more

The behavior of price activity in the Solana market reveals that the market has encountered strong resistance. This started as soon as price action in this market reached the $188.74 level. It appears that the market encountered significant headwinds, causing it to spiral downward afterward.
Solana (SOL) Price Prediction: May 24
SOL/USDT Long-term Trend: Bearish (Daily Chart)
Resistance Levels: $200, $250, and $300
Support Levels: $150, $100, and $50
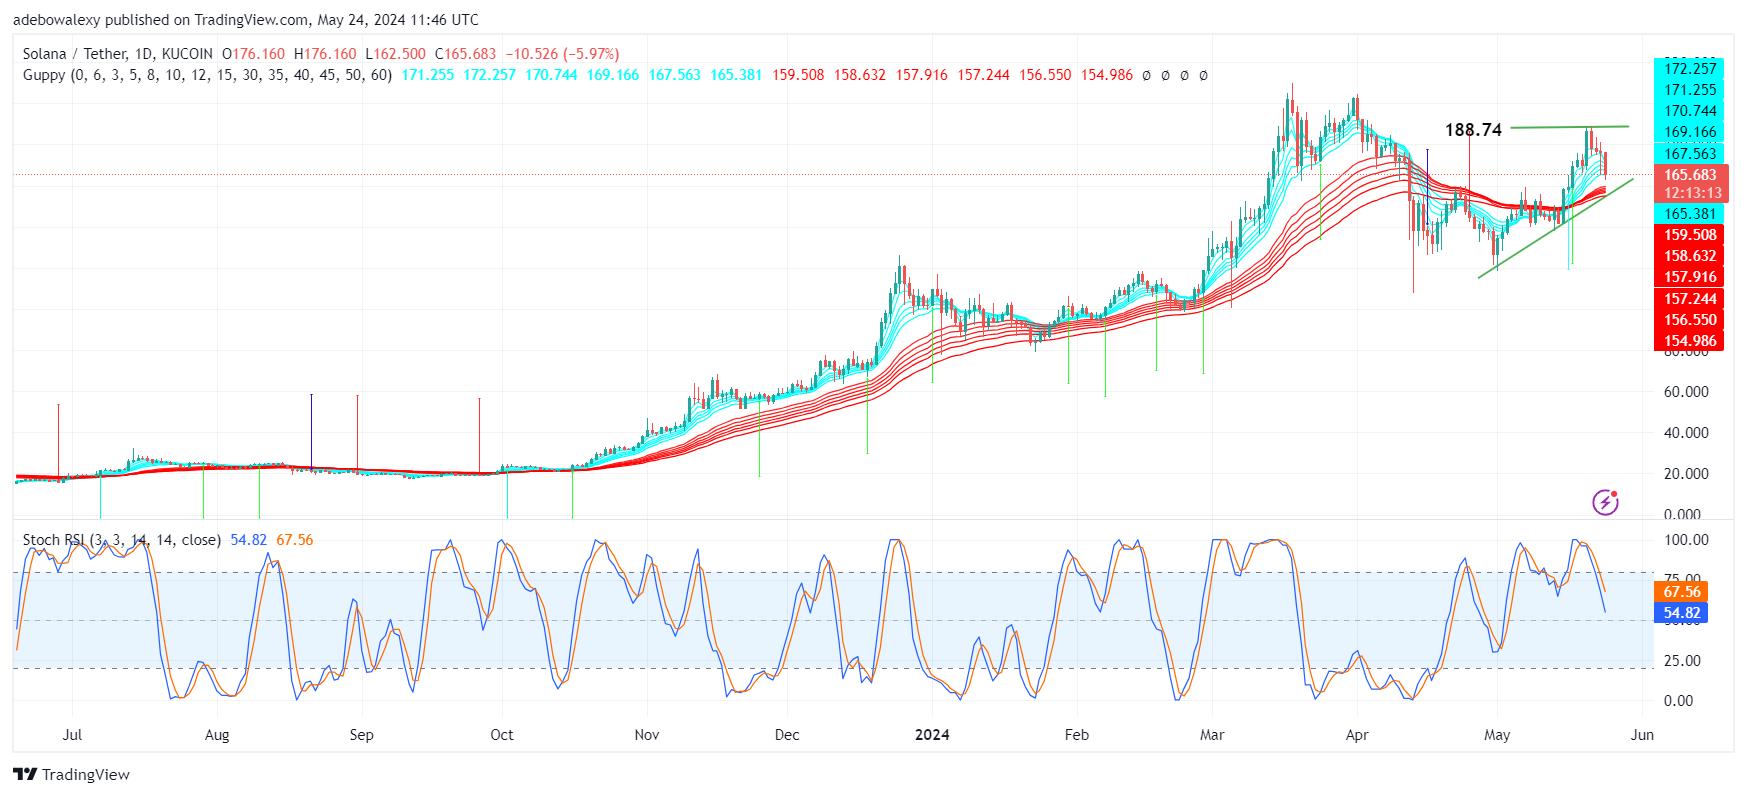
The downward correction that resulted as soon as price action hit the $188.74 resistance level seems quite strong. At this point, the market has retreated below the green Guppy Multiple Moving Average (GMMA) lines. Nevertheless, price action remains between the green and red GMMA lines. Meanwhile, the Stochastic Relative Strength Index (SRSI) lines have continued to fall towards the 40 mark of the indicator. However, the leading lines are still above the 50 mark.
Solana Price Prediction: Can Bulls Save the Day?
Although price movement in the SOL daily market has dipped considerably, it holds that upside hopes are still viable. The last price candle on this chart printed the most significant downward correction in recent times. However, it remains between the GMMA lines.
Additionally, the downward correction can still be seen above the upward-sloping trendline drawn on this chart. By implication, this suggests that the uptrend may still be regarded as ongoing. Therefore, as long as price action remains above the mentioned trendline and between the GMMA lines, we may see a recovery towards the $180.00 mark.
SOL/USDT Medium-term Trend: Downward Correction in the Solana Market Threatens to Intensify (4H Chart)
A quick look at the Solana price chart of 4 hours reveals that price action has fallen below a technical landmark. The last price candle here can be seen below the crossed GMMA indicator lines. Likewise, the Relative Strength Index (RSI) indicator lines can be seen dipping downward while still in the oversold region. However, one notable point is that price action remains above the drawn trendline. Meanwhile, the last price candle here has a shorter body that appears closer to the upper shadow than the lower one.

Technically, one can say the market is in a downward trend. Nevertheless, price action stands above our upward-sloping trendline. Also, the behavior of the last price candle shows that upside forces are already acting in this market. Therefore, all hope isn’t lost. The market may find its way back upwards toward the $188.74 mark.