Solana (SOL) Price Prediction: SOL/USDT Price Action Pushes Through the $150 Mark
Estimated Reading Time: 3 minutes
Don’t invest unless you’re prepared to lose all the money you invest. This is a high-risk investment and you are unlikely to be protected if something goes wrong. Take 2 minutes to learn more

Solana (SOL) Price Prediction: April 24, 2025
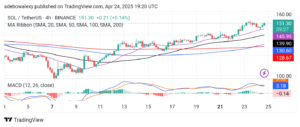
The recent upward rebound from the support near the $120 price level has continued to gain momentum. At the time of writing, the Solana market is trading above the $150 threshold. Consequently, price activity in this market lies above key technical levels, which may stimulate further buying interest.
SOL/USDT Long-Term Trend: Bullish (Daily Chart)
Key Price Levels:
Resistance: $160, $170, $180
Support: $150, $140, $130
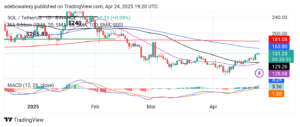
Price action on the Solana daily chart is situated above both the 20-day and 50-day Moving Average (MA) lines. These MA curves continue to converge for a potential bullish crossover beneath the price candles. The most recent candle remains green, indicating that bullish momentum is still present. Additionally, the Moving Average Convergence Divergence (MACD) indicator lines are positioned above the equilibrium level. Although the last MACD histogram bar appears pale green, it remains above the equilibrium, signaling continued bullish pressure.
Solana (SOL) Price Prediction: SOL/USDT Market May Keep Advancing
The previously analyzed Solana daily chart indicates an ongoing uptrend. Price action has advanced steadily since rebounding from the $120 support level, now rising above the 20-day and 50-day MA lines.
However, the most recent candle suggests that the price is currently encountering some resistance. Still, the convergence of the MA lines below the current price hints at the potential for further upward movement. Moreover, the MACD lines continue on an upward trajectory through the equilibrium level, reinforcing the ongoing bullish trend.
Solana (SOL) Price Prediction: SOL/USDT Eyes Higher Levels
The Solana 4-hour chart reveals a recent short-term pullback. However, bullish momentum quickly regained control, as the price rebounded smoothly after testing the 20-day MA curve. Trading activity remains above all MA lines.
Simultaneously, the MACD lines are positioned above the equilibrium level and have turned slightly sideways following the rebound. The MACD appears to be converging for another upward crossover, further supporting bullish sentiment. This suggests a possible breakout above the $160 resistance level.