Uniswap (UNI) Price Prediction: UNI/USDT Pulls Back Below the $6.00 Price Level
Estimated Reading Time: 2 minutes
Don’t invest unless you’re prepared to lose all the money you invest. This is a high-risk investment and you are unlikely to be protected if something goes wrong. Take 2 minutes to learn more

Uniswap (UNI) Price Prediction: April 24, 2025
Uniswap has continued to see limited buying interest for a while now. This has kept the market trading below important technical landmarks. The token briefly surpassed the $6.00 mark but failed to find support above this price region.
UNI/USDT Long-Term Trend: Bullish (Daily Chart)
Key Price Levels:
Resistance: $6.50, $7.00, $7.50
Support: $5.50, $5.00, $4.50
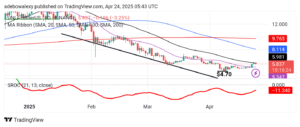
The Uniswap market recently tested resistance formed by the 50-day Moving Average (MA) line. This occurred in the previous session. The last price candle appears bearish, suggesting a downward retracement. Nevertheless, the Stochastic Rate of Change (SROC) indicator continues to rise toward the equilibrium level.
Uniswap (UNI) Price Prediction: UNI/USDT Market May Resurface Above the $6.00 Price Level Shortly
Looking at the Uniswap daily chart, it is evident that the market is retracing higher supports. The price candles for the past two sessions have appeared above the 20-day MA line.
However, the 50-day MA curve seems to have introduced a short-term barrier to upward movement, as indicated by the appearance of the last bearish price candle on the chart. In addition, the SROC indicator line remains on an upward path, despite being below the equilibrium level. This suggests bullish forces are still present but currently dormant in the market.
Uniswap (UNI) Price Prediction: UNI/USDT Appears to Be Holding Above Key Support
In the Uniswap 4-hour chart, price activity is above all MA lines. However, recent action shows some retracement to lower price levels.
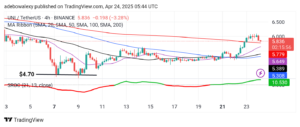
The previous session saw a stronger downward move, but the current session indicates that the price may hold above the 200-day MA line. As a result, the SROC indicator continues to trend upward above the equilibrium level. Based on this momentum, it appears that the market may find support above the 200-day MA and potentially push toward the $6.50 price level.