$SPONGE (SPONGE/USD) Moves Within $0.00002 – $0.00004 Range
Estimated Reading Time: 3 minutes
Don’t invest unless you’re prepared to lose all the money you invest. This is a high-risk investment and you are unlikely to be protected if something goes wrong. Take 2 minutes to learn more

Following our previous analysis, which noted a rebound in the SPONGE/USD market from the $0.00002 level, today’s analysis suggests continued bullish momentum. The price is steadily approaching higher levels, despite the bearish divergence identified in the previous analysis.
While the recent peak at approximately $0.000035 has increased downward pressure on the $0.00002 support level, potentially shifting it lower to around $0.0000186, the bulls remain resilient and are pushing for further upside.
Key Market Dynamics:
- Resistance Levels: $0.0010, $0.0011, $0.0012
- Support Levels: $0.000020, $0.0000195, $0.000019
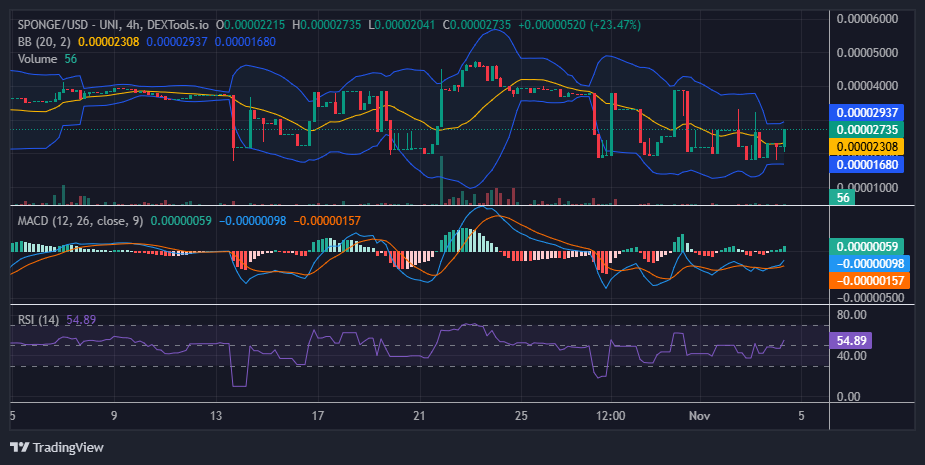
$SPONGE (SPONGE/USD) Technical Outlook
Analyzing the 4-hour chart of the SPONGE/USD market, a slight decrease in the support level suggests a potential increase in bearish sentiment. However, this does not necessarily signal a prolonged downward trend. Historically, the market has tested lower levels, with bulls consistently demonstrating resilience around this zone, making a potential upward rebound likely.
One indicator supporting this possibility is the wide Bollinger Bands, which signal ongoing volatility in the crypto market. This suggests that the recent price dip may not lead to a sustained bearish trend, as erratic and sharp price movements are typical in such volatile markets.
Traders should monitor key support levels closer to the crucial $0.00004 price level. Given the current volatility and the bullish bias at lower price levels like $0.00002, an upward price movement may occur soon.
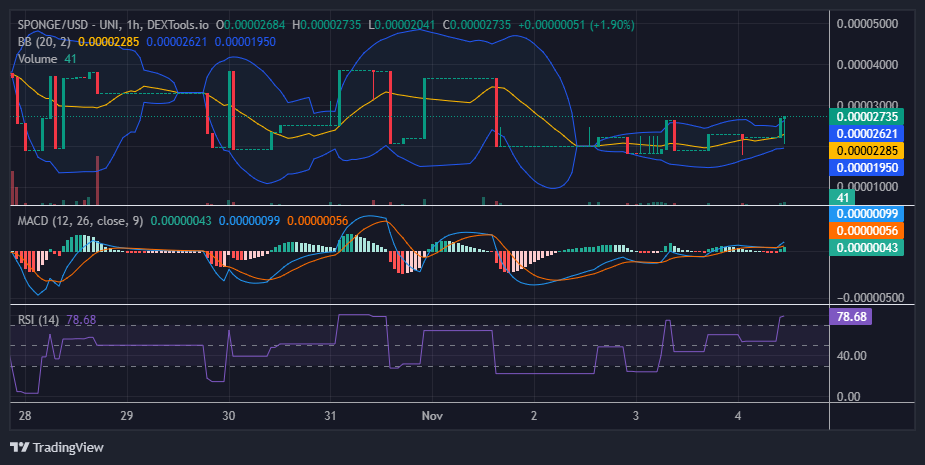
$SPONGE (SPONGE/USD) 1-Hour Chart Insights
The market is currently exhibiting upward momentum, indicating increased buying activity. The most recent one-hour trading session formed an inverted hammer candlestick pattern. This pattern is classically interpreted as a bullish reversal signal, suggesting that buyers are overcoming bearish resistance.
When an Inverted Hammer appears during the early stages of a bullish recovery following a downtrend, it indicates that sellers initially pushed the price lower but lost control as buyers stepped in, driving prices higher. This development reinforces lower price levels as key support areas where buyers maintain a bullish bias.
This suggests that buying pressure is beginning to outweigh selling pressure, which can signal a potential reversal. Investors should be aware of this development.
Buy $SPONGE!
degens as soon as the bull market hits pic.twitter.com/qMzVOr3rxF
— $SPONGE (@spongeoneth) November 1, 2024
Join the SPONGE community and be part of the next big crypto sensation! Buy Sponge ($SPONGE) today!