Bitcoin (BTC) Price Prediction: BTC/USDT Market Needs More Participation
Estimated Reading Time: 3 minutes
Don’t invest unless you’re prepared to lose all the money you invest. This is a high-risk investment and you are unlikely to be protected if something goes wrong. Take 2 minutes to learn more

Date: June 18, 2025
The Bitcoin market has been oscillating within a $12,000 range, specifically between the $100,000 and $112,000 price levels. Currently, the market is experiencing another upward retracement. However, whether this move will eventually breach the interim resistance at the $112,000 level remains.
BTC/USDT Long-Term Trend: Bearish (Daily Chart)
Key Price Levels:
Resistance: $108,000, $112,000, $116,000
Support: $104,000, $100,000, $96,000
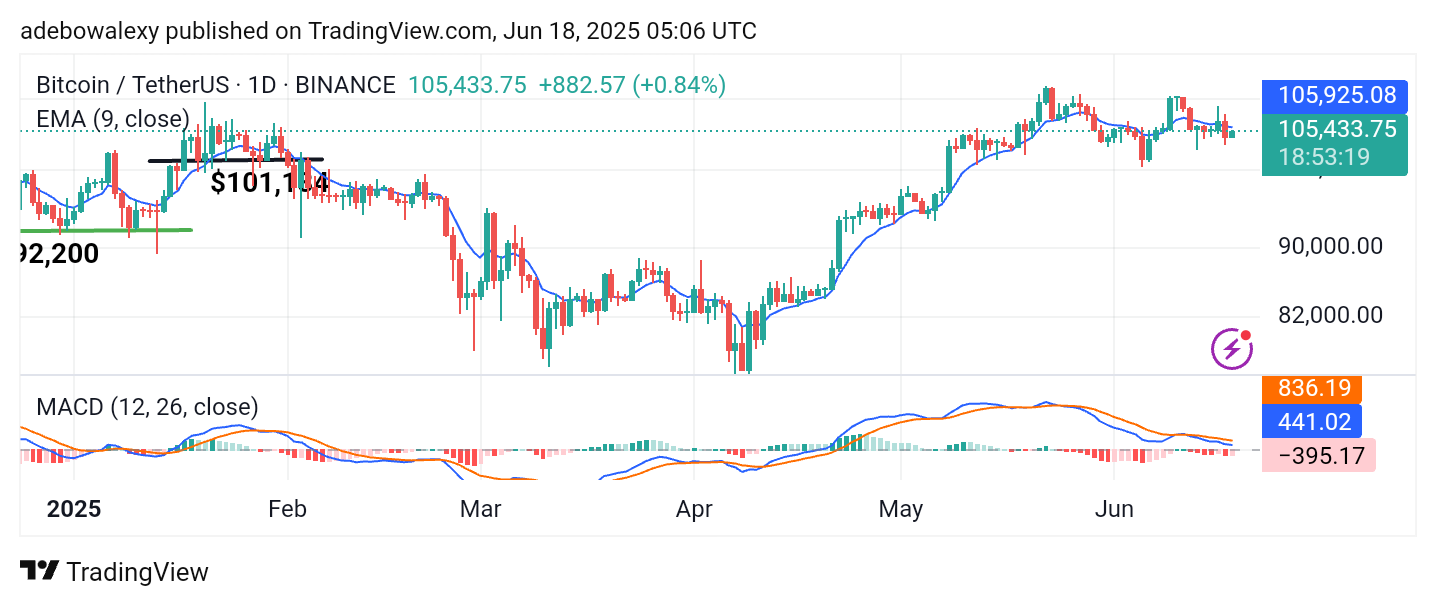
The most recent price candle on the daily chart is green but relatively small in size. The ongoing session is hovering around the 9-day Exponential Moving Average (EMA) line, though it remains below it. Meanwhile, the Moving Average Convergence Divergence (MACD) indicator lines are still positioned above the equilibrium level but show a slight downward trajectory. The histogram bars are alternating between solid and pale red, indicating weakening bullish momentum.
Bitcoin (BTC) Price Prediction: BTC/USDT Is Facing a Barrier
While the current session maintains a slightly bullish bias, there are growing indications that the Bitcoin market may resume a downward path. The bullish stance remains fragile, as price action lingers below the 9-day EMA line.
Similarly, although the MACD lines remain above the equilibrium level, they continue to trend downward, signaling a weakening bullish momentum. Therefore, medium-term traders may need to wait for clearer confirmation before entering long positions.
Bitcoin (BTC) Price Prediction: BTC/USDT Prepares to Breach a Key Resistance Level
Since Tuesday’s session, the Bitcoin market has shown consecutive green candles on the 4-hour chart. The current session’s corresponding candle is also green but smaller than the previous one. This candle is testing the 9-day EMA as a resistance level.
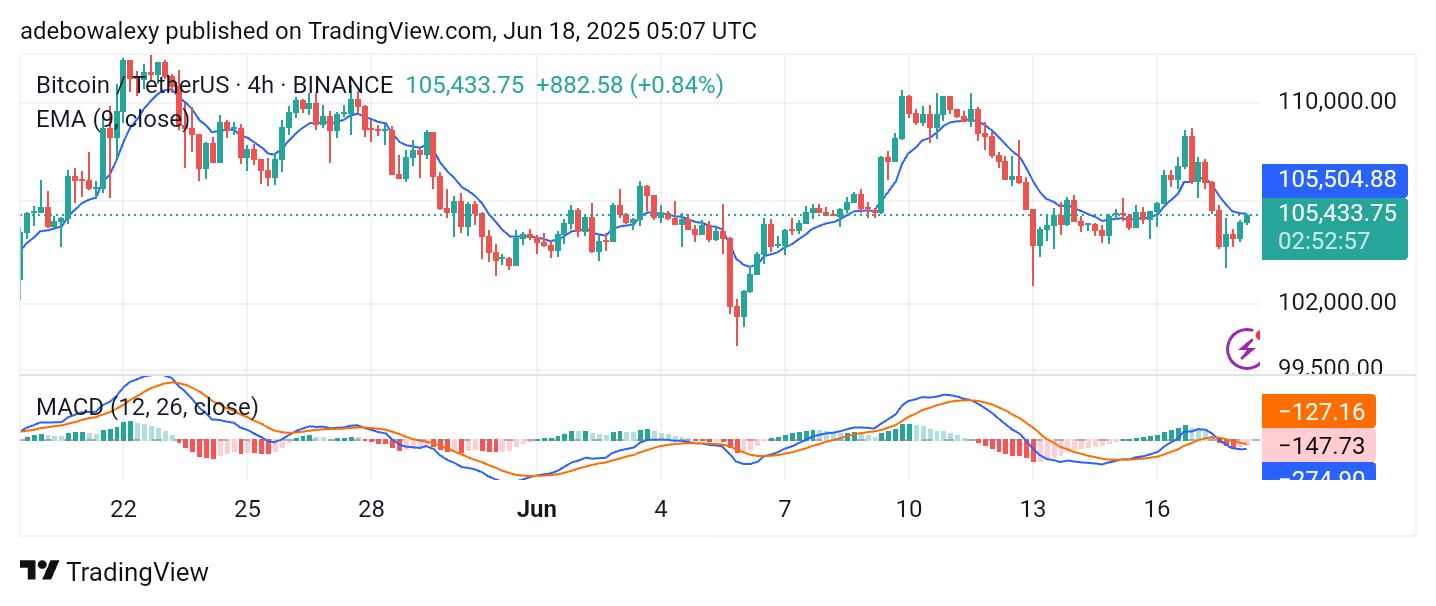
Furthermore, the MACD indicator lines are positioned below the equilibrium level, with histogram bars appearing pale red. Nevertheless, the indicator lines continue to converge beneath the midpoint, which may signal an upcoming crossover. This movement supports the current trajectory of the market.
However, traders may want to wait until price action decisively crosses above the 9-day EMA before targeting the $108,000 resistance level.