Litecoin (LTC) Price Prediction: LTC/USDT Lacks a Clear Direction
Estimated Reading Time: 2 minutes
Don’t invest unless you’re prepared to lose all the money you invest. This is a high-risk investment and you are unlikely to be protected if something goes wrong. Take 2 minutes to learn more

Date: June 17, 2025
The Litecoin market has remained subdued for an extended period. Even trading indicators show minimal signs supporting bullish activity. Let’s explore the current behavior of price movements in this market.
LTC/USDT Long-Term Trend: Bearish (Daily Chart)
Key Price Levels:
Resistance: $90, $100, $110
Support: $80, $70, $60
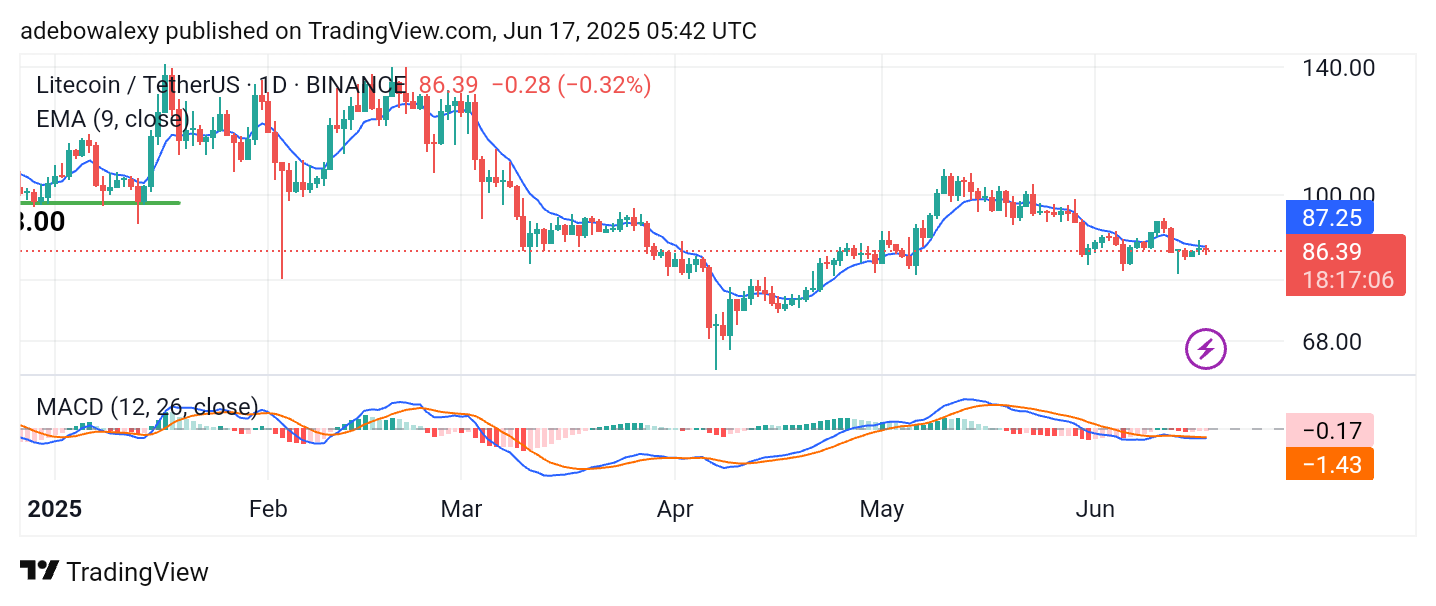
Price action in the Litecoin market remains below the 9-day Exponential Moving Average (EMA). The current price candle appears red, having just tested the 9-day EMA line as resistance. Meanwhile, the lines of the Moving Average Convergence Divergence (MACD) indicator have dropped below the equilibrium level. These lines appear to be merged and trending sideways, indicating indecision in market momentum.
Litecoin (LTC) Price Prediction: LTC/USDT Buyers Remain Cautious
The behavior of price movement in the Litecoin market does not reflect bullish strength. In the previous session, price action merely tested the 9-day EMA line, only for the ongoing session to rebound downward.
This has kept the market suppressed below the EMA line. Furthermore, the MACD lines remain merged below the equilibrium level with no signs of a crossover. The lines move sideways, technically signaling a lack of clear market direction.
Litecoin (LTC) Price Prediction: LTC/USDT May Fall to the $83 Mark
Price activity in this market continues to reflect bearish tendencies, as seen on the daily chart. The latest price candle also remains below the 9-day EMA line.
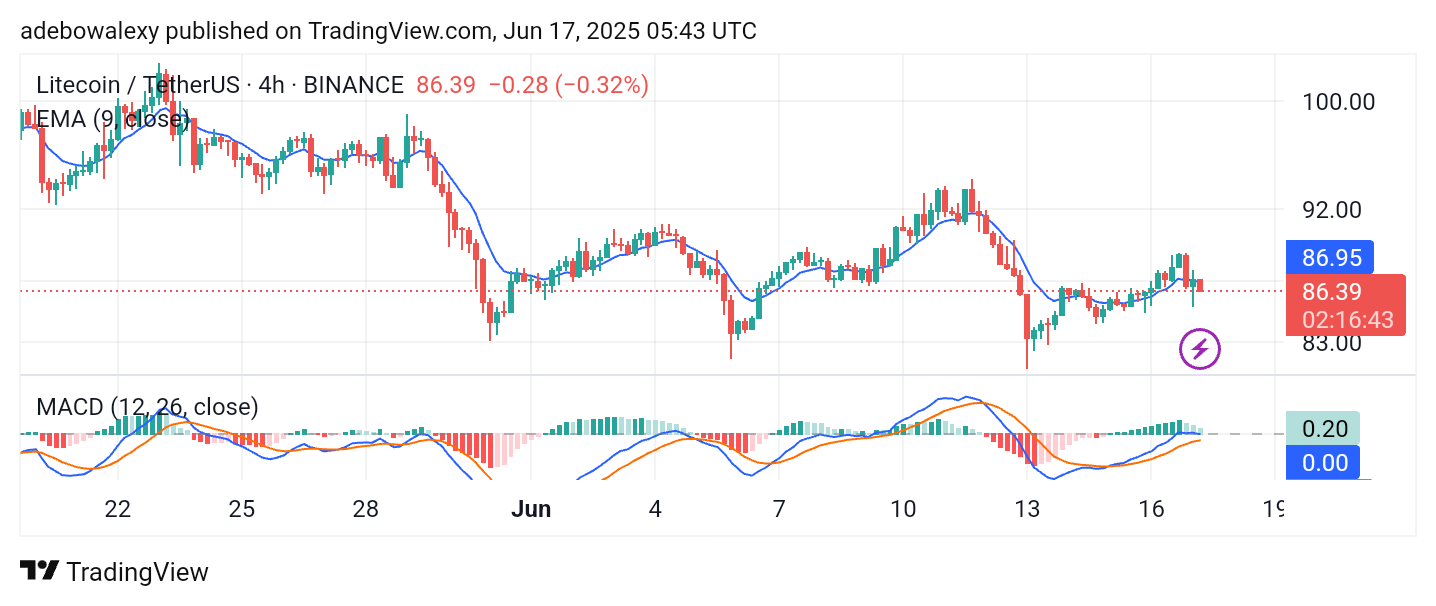
Likewise, the MACD indicator’s lead line recently tested the equilibrium level as resistance but has since turned sideways. In addition, the histogram bars have turned pale green and are gradually shrinking, signaling a weakening bullish momentum. Technically, this suggests that the market may decline further toward the $83.00 price level.