Dogecoin (DOGE) Price Prediction: DOGE/USDT Holds Above the $0.1700 Price Level
Estimated Reading Time: 3 minutes
Don’t invest unless you’re prepared to lose all the money you invest. This is a high-risk investment and you are unlikely to be protected if something goes wrong. Take 2 minutes to learn more

Date: June 16, 2025
The Dogecoin market has remained burdened below key levels for a considerable period. This, therefore, reinforces a bearish impression of the coin. Currently, however, the token trades just slightly above the $0.1700 price level. Let’s examine where the market may be headed next.
DOGE/USDT Long-Term Trend: Bearish (Daily Chart)
Key Price Levels:
Resistance: $0.2000, $0.2400, $0.2800
Support: $0.1700, $0.1300, $0.0900
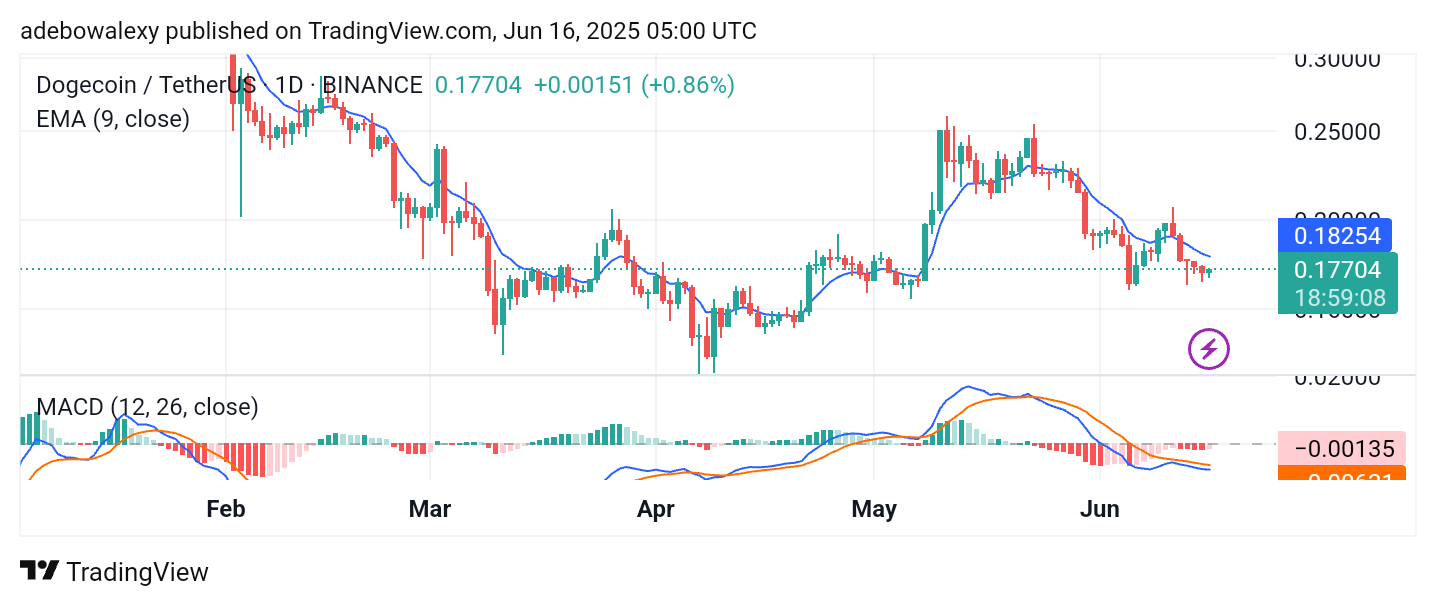
Price activity in this market has remained below the 9-day Exponential Moving Average (EMA) for the past four sessions. The ongoing session is represented by a green price candle that appeared after the price action tested a support level just below the $0.1750 mark. Meanwhile, the lines of the Moving Average Convergence Divergence (MACD) indicator continue moving downward below the equilibrium level. However, the histogram bars of the indicator are pale red, indicating weakening bearish momentum.
Dogecoin (DOGE) Price Prediction: DOGE/USDT Remains Under Pressure
Price action in the Dogecoin daily chart appears largely stagnant. Over the past four sessions, the market has exhibited straight bearish behavior, dragging the price below the 9-day EMA line. However, the current session is marked by a green candle with a compressed price.
Additionally, the MACD indicator lines are positioned below the equilibrium level and maintain a bearish trajectory. On the other hand, the MACD histogram bars have appeared in pale red, suggesting a reduction in bearish momentum. As a result, the price has posted a modest upward rebound in the ongoing session. Nevertheless, overall price action remains subdued and could potentially resume its downward trajectory.
Dogecoin (DOGE) Price Prediction: DOGE/USDT May Hold Short-Term Promise
On the 4-hour chart, the Dogecoin market is showing minimal gains. The most recent price candle stands just above the 9-day EMA line and is green.
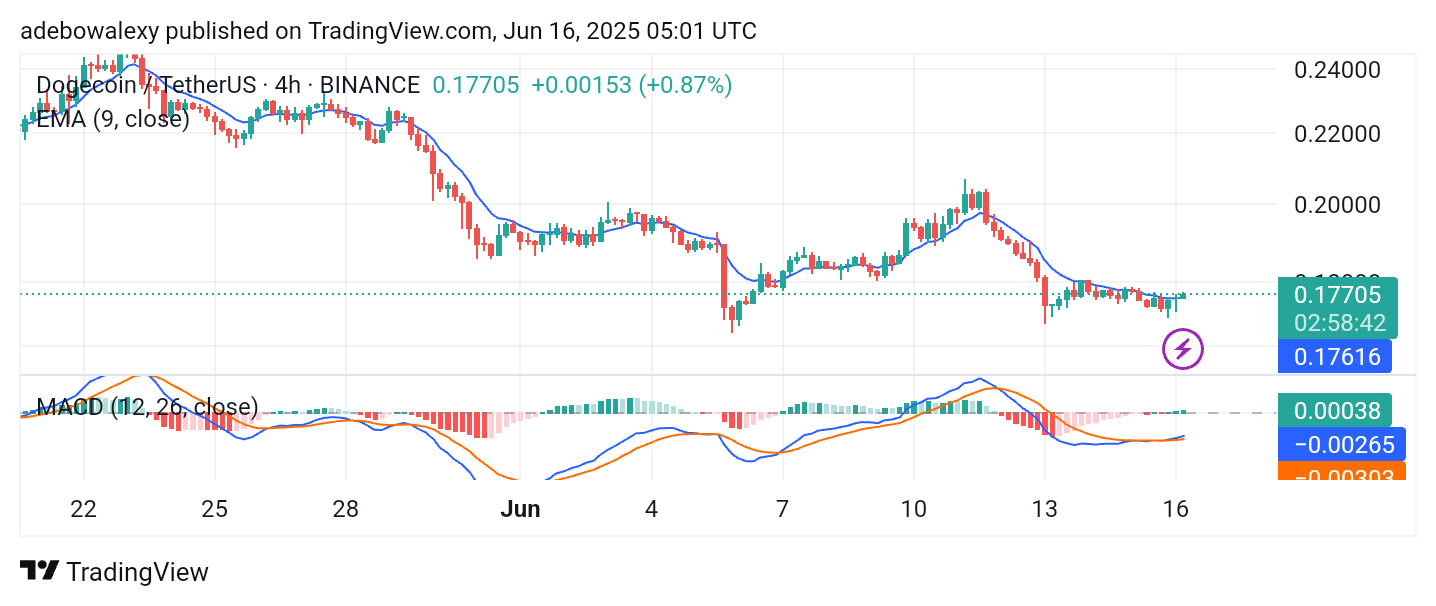
At the same time, the MACD indicator lines have just completed a bullish crossover, although still positioned below the equilibrium level. Likewise, green histogram bars have begun appearing above the equilibrium level of the MACD. Consequently, these signs suggest that the market may experience some short-term gains. Based on these indications, the price could potentially progress toward the $0.2150 level.