Polygon (ex-MATIC) Price Prediction: POL/USDT Heads Back Towards $0.2000
Estimated Reading Time: 3 minutes
Don’t invest unless you’re prepared to lose all the money you invest. This is a high-risk investment and you are unlikely to be protected if something goes wrong. Take 2 minutes to learn more

Date: June 14, 2025
The Polygon (ex-MATIC) market continues to strongly correlate with Bitcoin. Its price has sharply declined in response to the recent dip in the Bitcoin market. Currently, bearish momentum threatens to breach the key support level at $0.2000.
POL/USDT Long-Term Trend: Bearish (Daily Chart)
Key Price Levels:
Resistance: $0.2500, $0.2750, $0.3000
Support: $0.2000, $0.1500, $0.1000
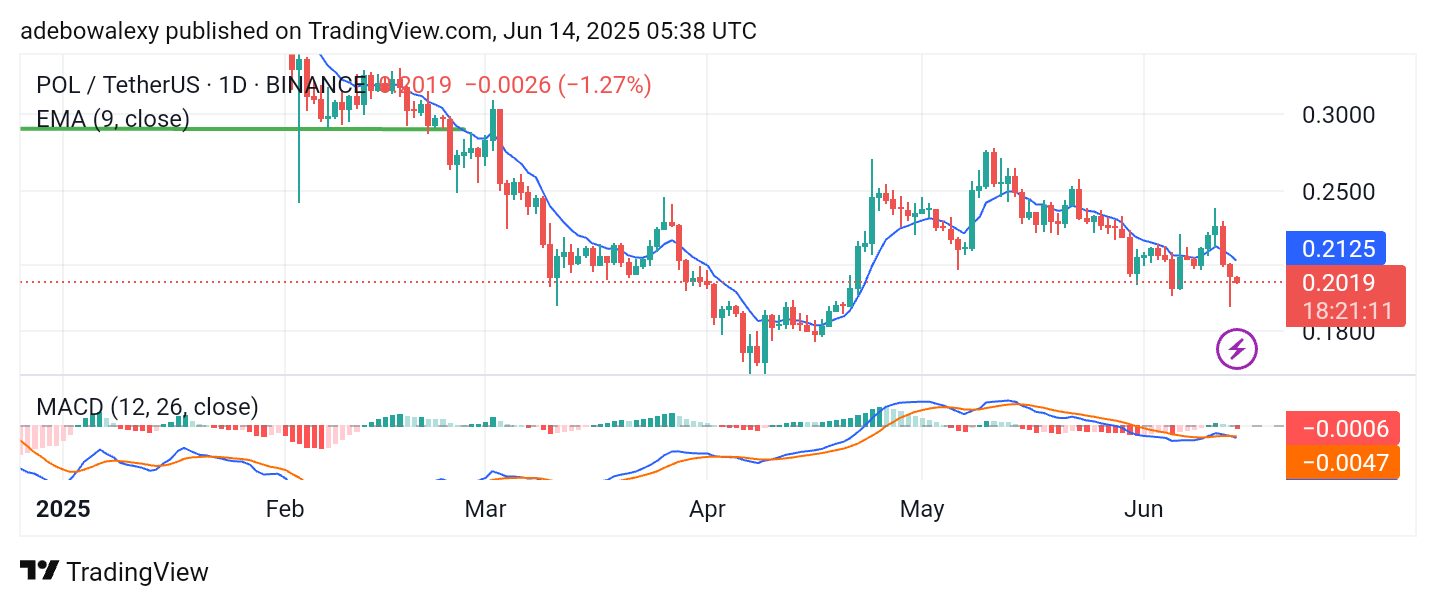
The Polygon (ex-MATIC) market is showing a sharp decline toward lower price levels. The ongoing session is represented by a red candle on the daily chart, indicating a continuation of the downward trend below the 9-day Exponential Moving Average (EMA) line. Similarly, the Moving Average Convergence Divergence (MACD) indicator line is below the equilibrium level and has just formed a bearish crossover. The latest MACD histogram bar is also red, reinforcing the bearish outlook.
Polygon (ex-MATIC) Price Prediction: Bearish Pressure Remains in the POL/USDT Market
According to the daily chart, bearish activity dominates the Polygon (ex-MATIC) market. For three consecutive sessions, the market has closed in the red. However, judging by the size of the recent candles, bearish momentum appears to be waning slightly.
Despite this, price action remains below the 9-day EMA line, signaling that bears are still in control. Furthermore, the MACD lines are positioned below the equilibrium level, which supports the prevailing bearish sentiment. As a result, the price seems likely to continue trending lower in the near term.
Polygon (ex-MATIC) Price Prediction: POL/USDT Consolidates But May Drop Lower
On the Polygon (ex-MATIC) 4-hour chart, price action continues to trade below the 9-day EMA curve. Over the past four sessions, candles have appeared at approximately the same horizontal level, indicating consolidation. While the most recent candle is green, it is small and still located beneath the EMA line—suggesting that sellers remain dominant.
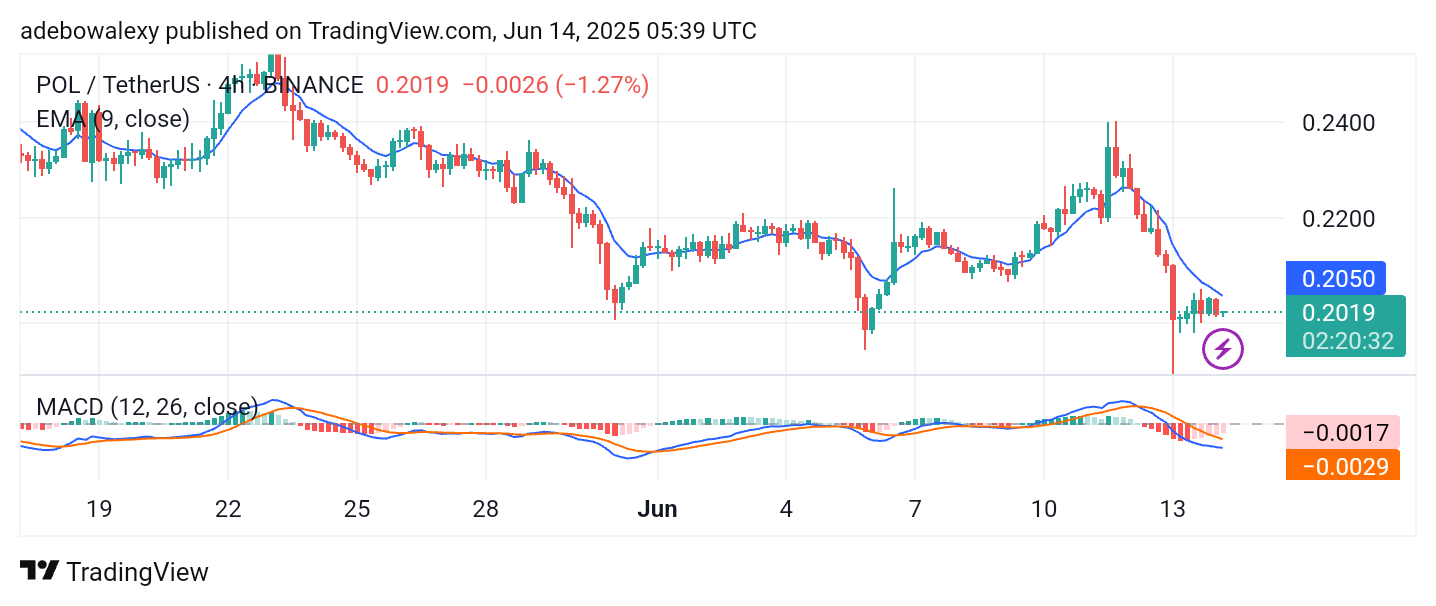
Additionally, the MACD lines remain below the equilibrium level. Although the MACD histogram bars are now pale red, this seems to reflect the ongoing consolidation phase. Consequently, the market may soon retrace toward the $0.1900 level.