Solana (SOL) Price Prediction: SOL/USDT Goes Downhill
Estimated Reading Time: 2 minutes
Don’t invest unless you’re prepared to lose all the money you invest. This is a high-risk investment and you are unlikely to be protected if something goes wrong. Take 2 minutes to learn more
Date: June 13, 2025
Ever since Bitcoin has been experiencing bearish retracements, the Solana market has also been following suit. The price of the SOL token has dropped from $155 to $143.79. Let’s examine the market below for further insights.
SOL/USDT Long-Term Trend: Bearish (Daily Chart)
Key Price Levels:
Resistance: $150, $175, $200
Support: $140, $120, $100
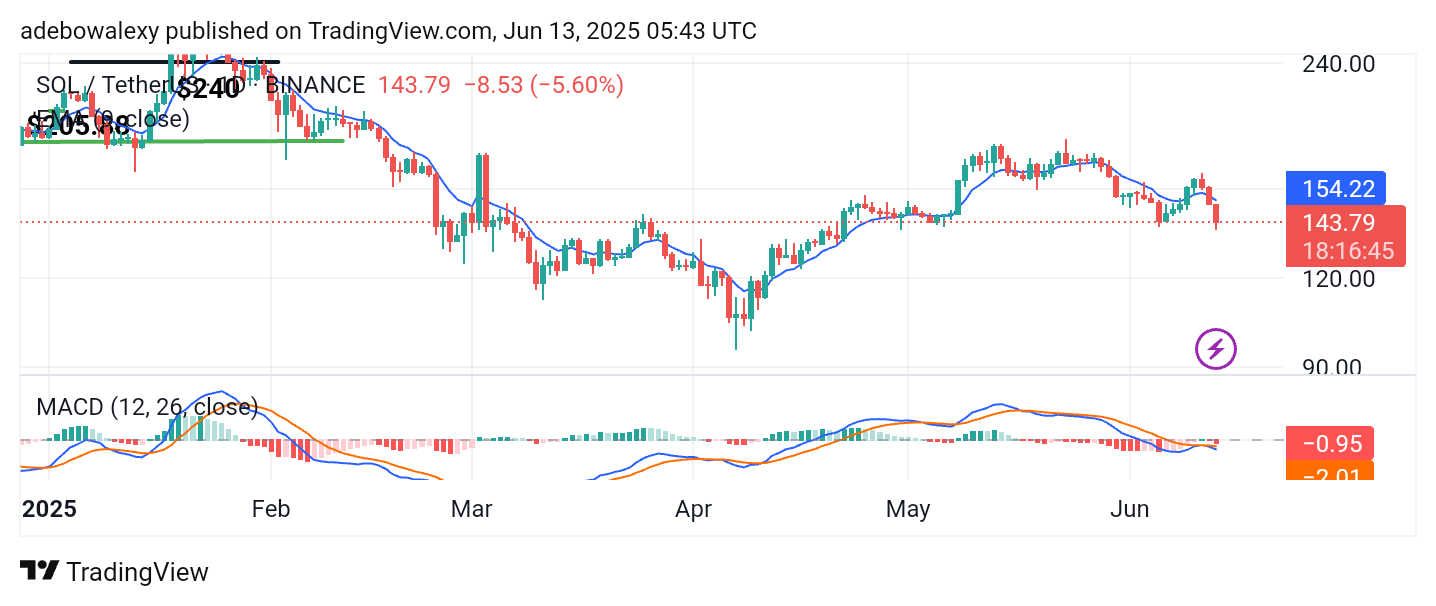
Price activity in the Solana market has followed a bearish trajectory. For the past three sessions, bearish candlesticks have appeared consistently on the daily chart. The most recent candlestick is below the 9-day Exponential Moving Average (EMA). At the same time, the Moving Average Convergence Divergence (MACD) indicator lines are below the equilibrium level, with red histogram bars already forming beneath the zero line.
Solana (SOL) Price Prediction: SOL/USDT May Plunge Lower
With price action remaining below the 9-day EMA on the daily chart, it appears that further declines may be ahead. Over the past two sessions, bearish sentiment has dominated the Solana market. A closer look at the price of candles suggests that the downward momentum may be moderately strong.
In addition, the MACD indicator lines are now below the equilibrium level after a bearish crossover. The MACD line appears to be continuing on a downward path. Consequently, the market may be establishing a new downtrend.
Solana (SOL) Price Prediction: SOL/USDT May Hit the $140 Mark
Price activity on the Solana 4-hour chart has taken on a much stronger bearish tone. The previous session saw notable progress in bearish momentum, and the current session continues to reflect bearish control. Meanwhile, trading activity remains below the 9-day EMA.
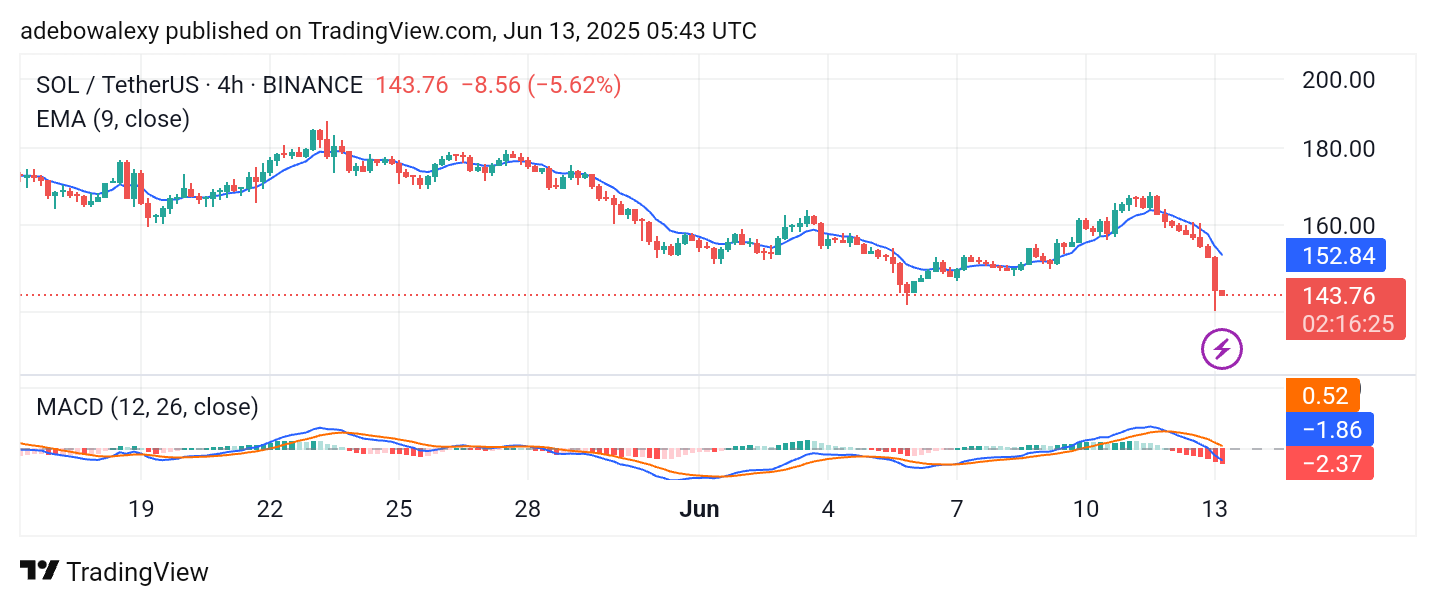
The MACD lines are below the equilibrium level, and solid red histogram bars are appearing, confirming the strength of bearish pressure. Based on these technical indicators, it appears that the market may soon breach the $140 support level, as bearish forces maintain a strong presence.