Lucky Block Price Prediction: LBLOCK/USD Could Revisit $0.000025 Support
Estimated Reading Time: 3 minutes
Don’t invest unless you’re prepared to lose all the money you invest. This is a high-risk investment and you are unlikely to be protected if something goes wrong. Take 2 minutes to learn more
Lucky Block Price Prediction – October 10
The Lucky Block price prediction shows that LBLOCK is preparing for a shock as the technical indicator gets ready to send it to $0.000030.
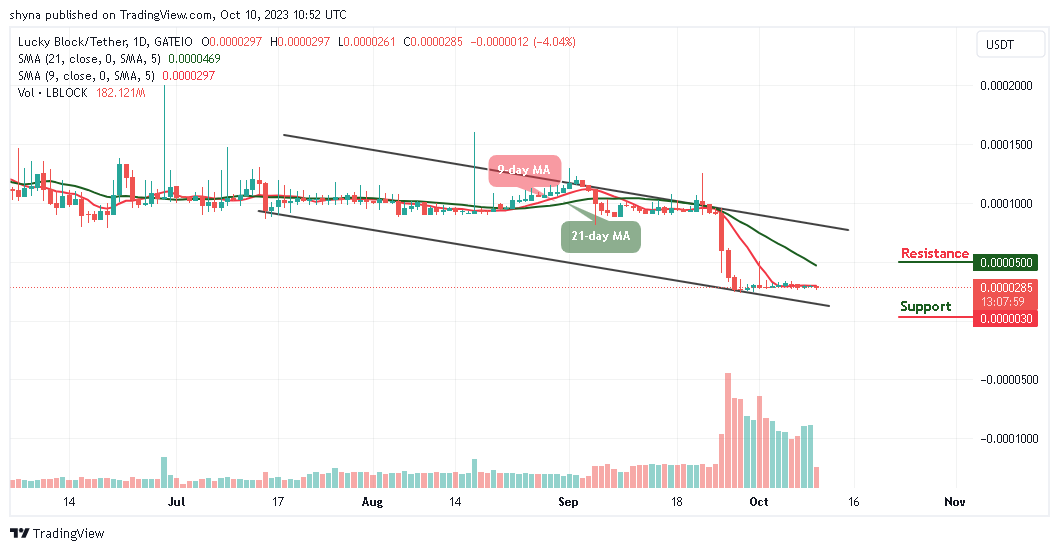
LBLOCK/USD Long-term Trend: Ranging (Daily Chart)
Key levels:
Resistance Levels: $0.000050, $0.000060, $0.000070
Support Levels: $0.000003, $0.000002, $0.000001
LBLOCK/USD is likely to fall toward $0.000025 once again as the coin embarked on a support smashing exercise after failing to hold above $0.000030 following a significant breakout in the last few days.
Lucky Block Price Prediction: Would Lucky Block Break to the North?
At the time of writing, the Lucky Block price is working on how to recover above $0.000030 from the daily low of $0.000026. However, if bulls increase their entries, they will create more volume, in turn, pushing the market price toward the 21-day moving average. Therefore, the further bullish movement may reach other resistance levels at $0.000050, $0.000060, and $0.000070.
Meanwhile, LBLOCK/USD is still in an area with intense support as the coin moves within the 9-day moving average. This explains the immediate reversal above $0.000026. On the other hand, a breakdown under the pattern’s support is likely to encourage more selling entries which could pull the Lucky Block massively below $0.000020. However, losses below the lower boundary of the channel could signal more retracement closer to $0.000003, $0.000002, and $0.000001 supports.
LBLOCK/USD Medium-Term Trend: Bearish (4H Chart)
On the 4-hour chart, the Lucky Block price keeps hovering within the 9-day and 21-day moving averages and the immediate support is below the moving averages at the $0.000025 level. The price may likely fall below $0.000020 if the bears fully stepped back into the market.
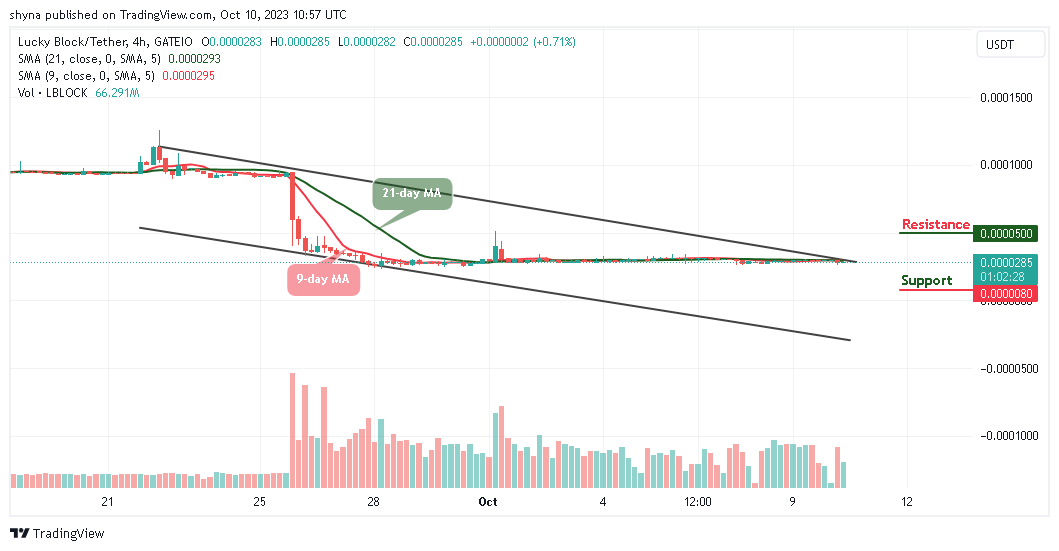
However, a further bearish movement could test the critical support at the $0.000008 level and below while the resistance is located above the upper boundary of the channel at $0.000050 and above. Technically, Lucky Block is currently moving sideways as the moving averages move in the same direction.
You can purchase Lucky Block here. Buy LBLOCK