Lucky Block Price Prediction: LBLOCK/USD Recently Touches $0.000029 Support
Estimated Reading Time: 3 minutes
Don’t invest unless you’re prepared to lose all the money you invest. This is a high-risk investment and you are unlikely to be protected if something goes wrong. Take 2 minutes to learn more
Lucky Block Price Prediction – October 9
The Lucky Block price prediction now manages to hold onto the critical support level of $0.000029 once again.
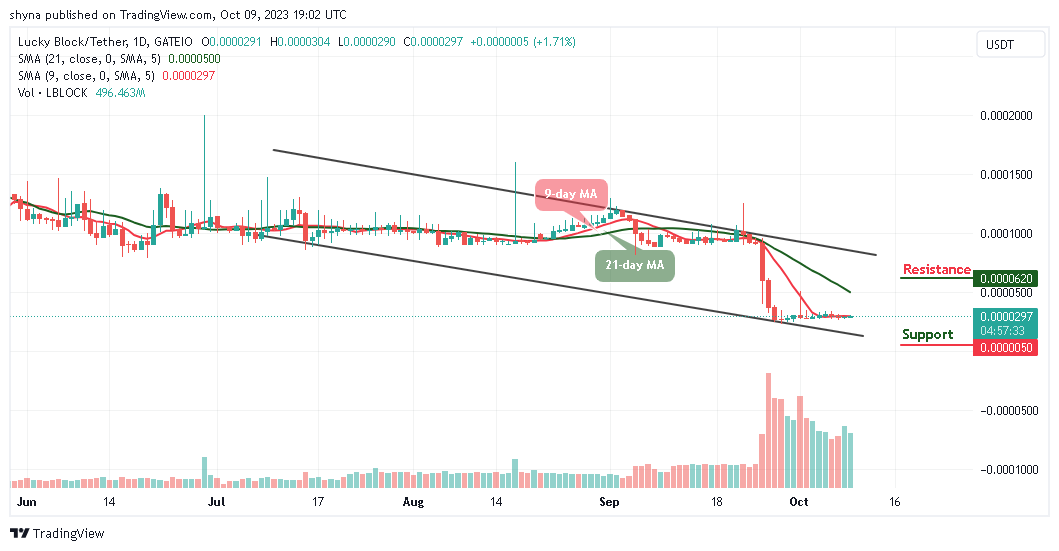
LBLOCK/USD Long-term Trend: Bearish (Daily Chart)
Key levels:
Resistance Levels: $0.000062, $0.000063, $0.000064
Support Levels: $0.0000050, $0.0000040, $0.0000030
LBLOCK/USD would undergo an aggressive bull run in the coming sessions, with their upside price targets lurking anywhere between the most important $0.000030 and $0.000032 resistance levels. However, Lucky Block typically pulls back after testing the 9-day moving average to touch the line. Moreover, the cryptocurrency continues with the sideways movement where it can locate a support base before retracing its movement to the upside.
Lucky Block Price Prediction: LBLOCK Keeps Moving Sideways
The past few days were somewhat similar, as the Lucky Block price even dipped below the $0.000030 level. Meanwhile, since LBLOCK/USD plummeted in value last week, it will begin to recover and push the market price above the 9-day moving averages. However, the bulls are expected to start pushing the cryptocurrency toward the north.
Nevertheless, if the market price moves above the 21-day moving average, it will signal a jump toward $0.000050, while breaking below the lower boundary of the channel may see Lucky Block drop to $0.000020. Therefore, any bullish movement toward the north could locate the resistance levels at $0.000062, $0.000063, and $0.000064 while the supports lie at $0.0000050, $0.0000040, and $39,000 respectively.
LBLOCK/USD Medium-term Trend: Ranging (4H Chart)
The Lucky Block price is now trading around $0.000029 as the coin continues with the sideways movement. Looking at the 4-hour price chart, traders can see that the bullish supply is coming up slowly in the market, but the bears are also trying to drag the price below the 9-day and 21-day moving averages. Meanwhile, the $0.0000030 support level and below may come into play if LBLOCK heads toward the south.
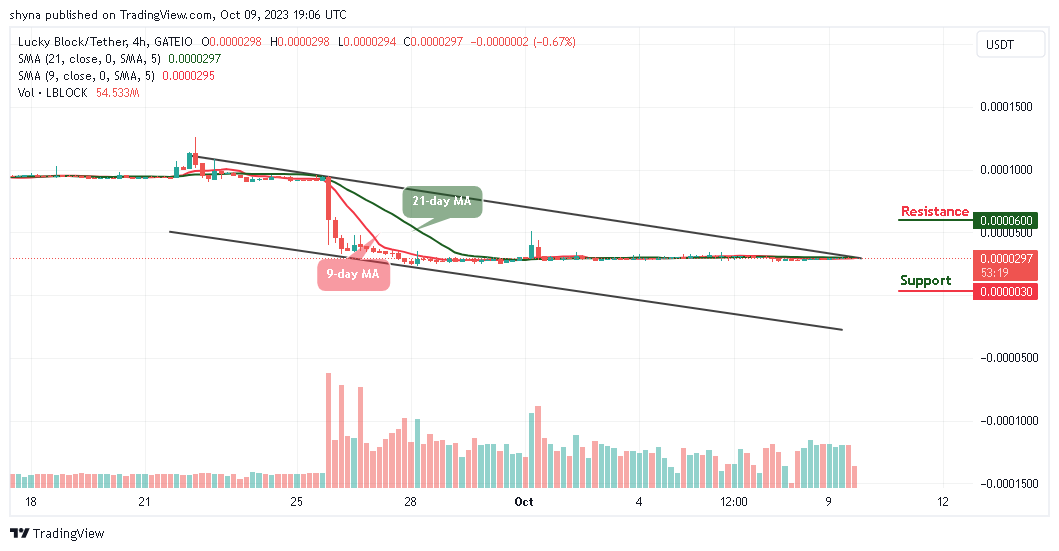
However, if buyers can strengthen and push the market price above the upper boundary of the channel, traders can expect a retest of $0.000050 resistance level. Therefore, breaking the mentioned resistance could also allow the bulls to test the $0.000062 and above. Moreover, LBLOCK/USD is consolidating currently and moving sideways on the medium-term outlook.
You can purchase Lucky Block here. Buy LBLOCK