Lucky Block Price Prediction: LBLOCK/USD Extend Sideways Above $0.0000340 Level
Estimated Reading Time: 3 minutes
Don’t invest unless you’re prepared to lose all the money you invest. This is a high-risk investment and you are unlikely to be protected if something goes wrong. Take 2 minutes to learn more
Lucky Block Price Prediction – October 6
The Lucky Block price prediction shows that LBLOCK is in consolidation mode as the coin prepares for upward movement.
LBLOCK/USD Long-term Trend: Ranging (Daily Chart)
Key levels:
Resistance Levels: $0.000065, $0.000067, $0.000069
Support Levels: $0.0000020, $0.0000018, $0.0000016
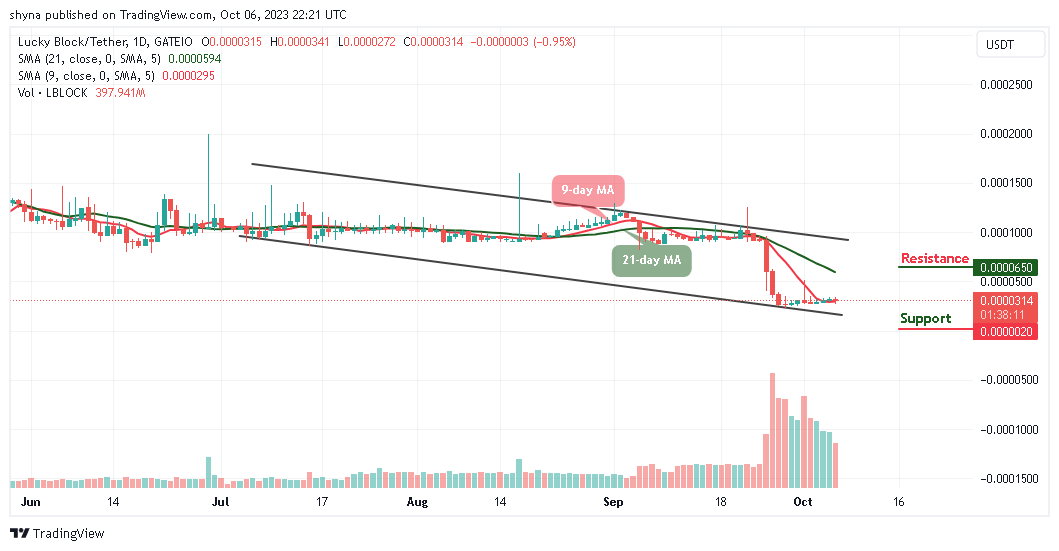
Currently, LBLOCK/USD has yet to make a serious gain as the coin hovers at $0.00031. For now, the price is seriously struggling in consolidation mode on intraday trading, which has made the LBLOCK indecisive recently. But if the buyers can regroup and overcome the supply area, traders could see a decent bullish run in the market soon.
Lucky Block Price Prediction: What to Expect From LBLOCK
The Lucky Block price is currently trading at $0.000031 but technically supported by $0.000027 on short-term and $0.000025 support in the medium term. If the price of Lucky Block drops below these supports, traders should expect long-term support levels of $0.0000020, $0.0000018, and $0.0000016 respectively.
However, if the buyers power the market, traders can expect a retest at the $0.0000340 resistance level. Breaking the mentioned resistance may allow the bulls to test the potential resistance at $0.000065, $0.000067, and $0.000069 on the upside. However, as the coin moves in the same direction on the daily chart, the market price is currently consolidating and moving sideways on the long-term outlook.
LBLOCK/USD Medium-term Trend: Ranging (4H Chart)
On the 4-hour chart, LBLOCK/USD is still trading around $0.0000314 after touching $0.0000315 in the early hours of today. Looking at the hourly price chart, traders can see that the bearish supply is coming into the market slowly, but the bulls are also trying to defend the $0.0000314 level. Meanwhile, the $0.0000080 support level and below may come into play if LBLOCK breaks the mentioned support.
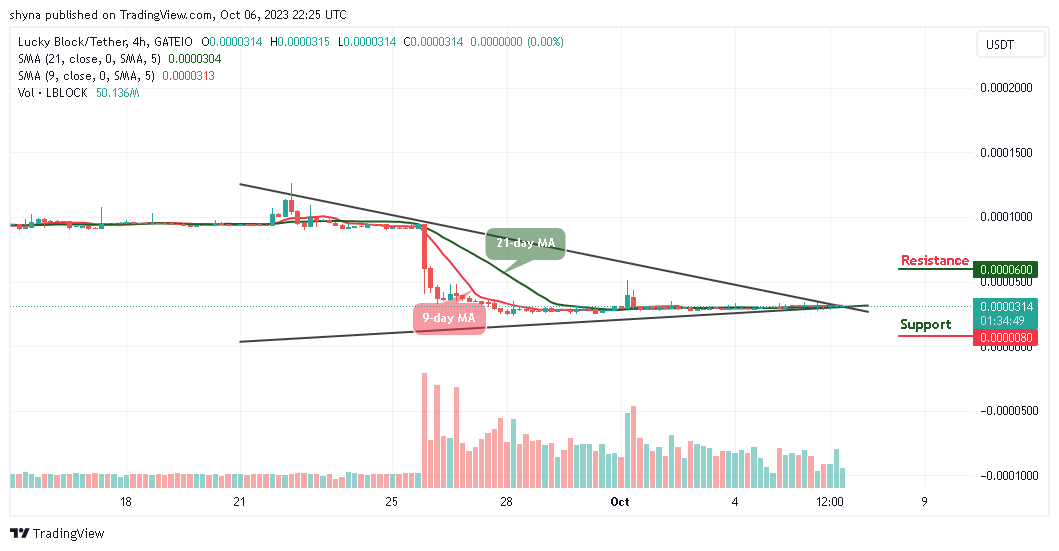
However, if buyers can strengthen and energize the market, traders can expect a retest of $0.00000315 resistance level. Therefore, breaking the mentioned resistance could also allow the bulls to test the $0.000060 and above. Meanwhile, LBLOCK/USD is consolidating and moving sideways on the medium-term outlook.
You can purchase Lucky Block here. Buy LBLOCK