Zcash (ZEC/USD) Bulls Revive After Market Lull
Estimated Reading Time: 3 minutes
Don’t invest unless you’re prepared to lose all the money you invest. This is a high-risk investment and you are unlikely to be protected if something goes wrong. Take 2 minutes to learn more
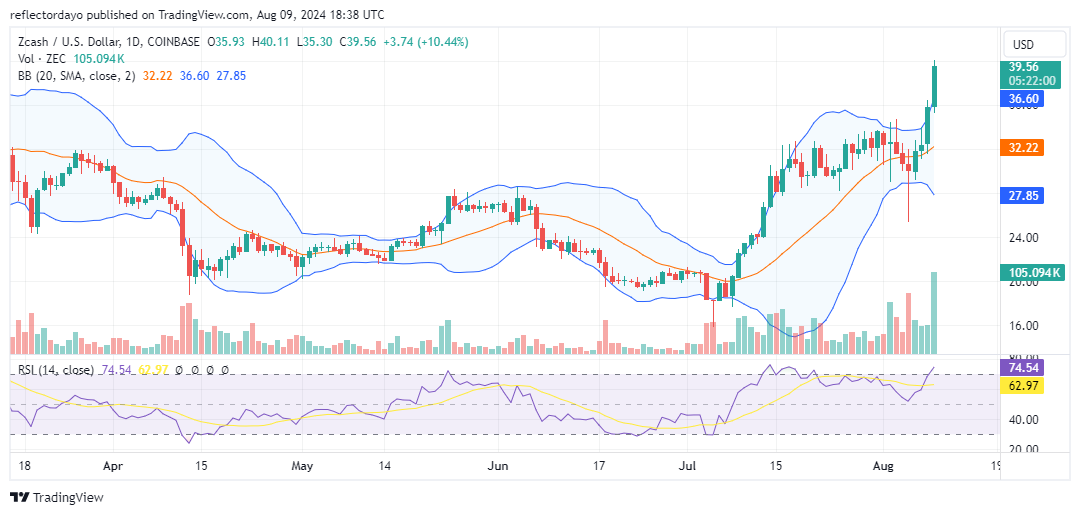
Reviewing Zcash‘s performance in recent daily sessions, July was notably bullish for the market. However, the strong ZEC/USD bulls paused their rally upon reaching the $32 price threshold. From mid-July to early August, investors appeared indecisive, leading to a sideways trading range until the market found support at the $30 level. At this point, renewed buying momentum emerged, allowing the market to easily break through the key resistance level that had held since mid-July.
Zcash Market Data
- ZEC/USD Price Now: $39.36
- ZEC/USD Market Cap: $490 million
- ZEC/USD Circulating Supply: 16.3 million
- ZEC/USD Total Supply: 16.3 million
- ZEC/USD CoinMarketCap Ranking: #115
Key Levels
- Resistance: $40.00, $45.00, and $50
- Support: $30.00, $25.00, and $20.00.
Zcash Market Through the Lens of Indicators
The market is currently experiencing aggressive bullish momentum, leading to increased volatility. The divergence of the Bollinger Bands indicates potential concerns about a significant bearish reversal. However, the trading volume indicator suggests strong support for the bullish trend, as the recent daily trading session’s histogram matches the strength of the actual candlestick. This crypto signal implies that the Zcash bullish trend is credible and that bearish momentum may not significantly impact the gains made by the bulls.
Should a market correction occur, the $35 price level could serve as a higher support threshold. Nonetheless, the Relative Strength Index (RSI) is indicating overbought conditions, suggesting that a correction may be imminent. If this correction takes place, the $35 price level is likely to emerge as a strong support zone.
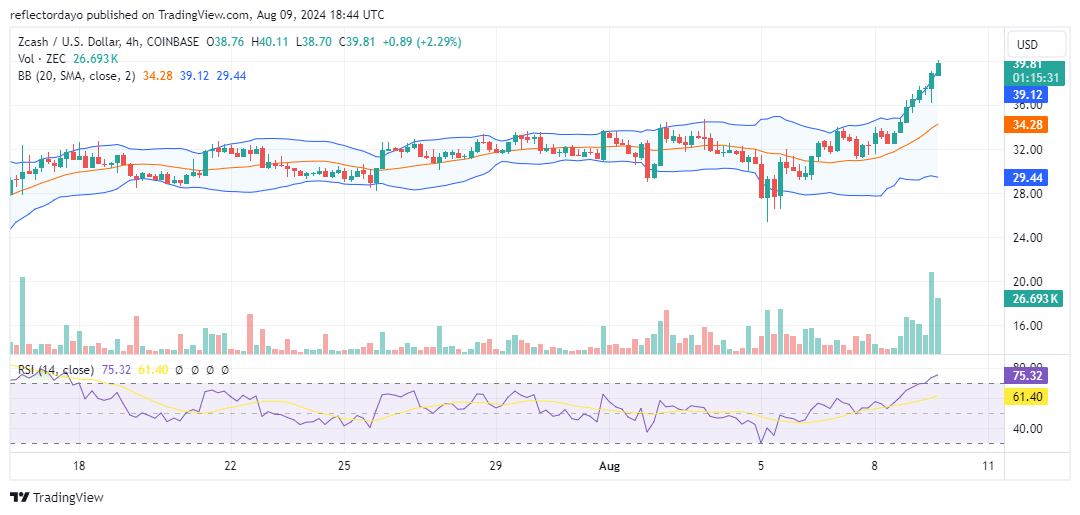
ZEC/USD Price Prediction: 4-Hour Chart Analysis
A short-term analysis reveals the emergence of resistance at the $40 price level. The appearance of an upper shadow on the last bullish candlestick indicates the potential onset of a price correction, which traders should monitor closely. The trading volume indicator also shows a decline in the most recent histogram, suggesting that some traders are taking profits, leading to reduced trading volume. Despite this, the overall market outlook still reflects strong bullish sentiment. This suggests that other factors may be driving the market upward.