Tamadoge (TAMAUSD)’s Bullish Trend Is Very Likely to Issue from the $0.0100 Price Level
Estimated Reading Time: 3 minutes
Don’t invest unless you’re prepared to lose all the money you invest. This is a high-risk investment and you are unlikely to be protected if something goes wrong. Take 2 minutes to learn more

Since July 7, the TAMAUSD market has been primarily range-bound, trading within a relatively tight range around the $0.01000 level. This consolidation phase is characterized by the market’s inability to establish a clear direction, as reflected in the lack of significant price movements.
It is noteworthy that this price consolidation is what followed a very significant bear market that made the price fall from the $0.014 price zone. The continuous eastward-moving market is a could sign of an imminent bullish price breakout
Key Levels
- Resistance: $0.035, $0.040, and $0.045
- Support: $0.012, $0.011, and $0.010.
TAMAUSD Price Analysis: The Indicators’ Point of View
Analyzing the TAMAUSD market through the Bollinger Bands indicator, we observe the formation of a narrow price channel. The Bollinger Bands are now displaying a contraction, indicating reduced volatility. This tightening of the bands suggests a period of consolidation and a potential buildup of energy for a potential breakout in the future.
The price action has been closely tracking the 20-day moving average, moving in tandem with it. This indicates that the moving average is acting as a dynamic support or resistance level, influencing the market’s short-term trend.
Considering the current contraction in the Bollinger Bands and the range-bound price action along with the 20-day moving average, it suggests a period of indecision and equilibrium between buyers and sellers. Traders may interpret this as a potential calm before a significant price move.
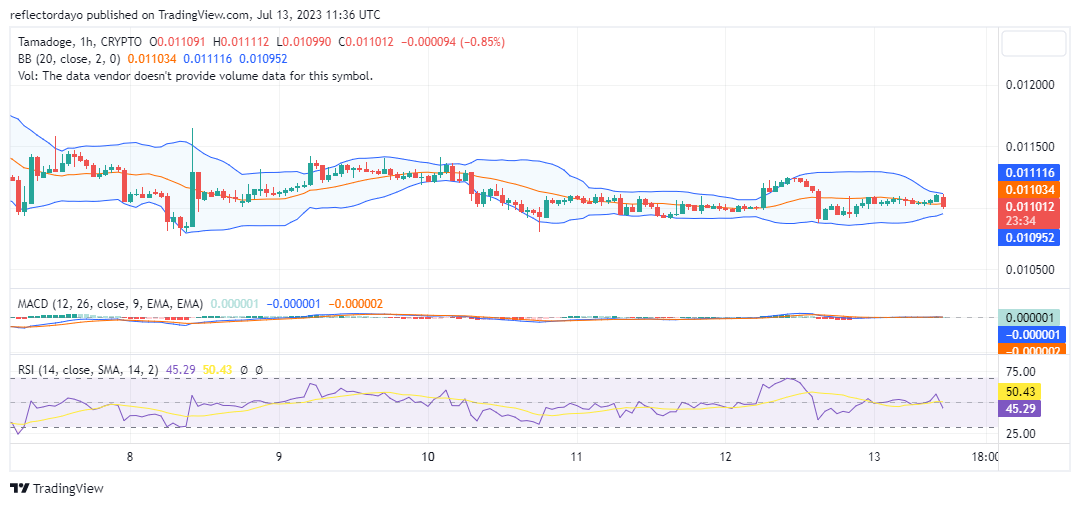
TAMA/USD Short-Term Outlook: 1-Hour Chart
In the 1-hour timeframe, we have observed a growing volatility squeeze in the Bollinger Bands indicator as the price action crosses above the 20-day moving average. This indicates a strengthening bull market, setting the stage for a potential bullish price breakout.
Furthermore, upon closer examination of the Bollinger Bands indicator, it becomes apparent that both the two standard deviation curves and the moving average are now starting to move upward.
Claim your top spot now!
You know what time it is… 🏆
It’s a fresh week, so we have fresh leaderboards for you, Tama Army! 💪
Claim your top spot now! 🥇⭐️https://t.co/oQzq6xUqrW pic.twitter.com/Sa0Sih5Td7
— TAMADOGE (@Tamadogecoin) July 13, 2023
Do you want a coin that will be 100 times more valuable in the next few months? That is Tamadoge. Buy TAMA today!


