Wall Street Memes (WSM/USD) Price Is Lowly, Pushing for Hikes
Estimated Reading Time: 3 minutes
Don’t invest unless you’re prepared to lose all the money you invest. This is a high-risk investment and you are unlikely to be protected if something goes wrong. Take 2 minutes to learn more

Wall Street Memes Price Prediction – January 19
The pushing velocities that depict the representation trade signals between ups and downs in the deals of Wall Street Memes versus the market weight of the US currency have continued to stage between the range-bound zones of $0.0012 and $0.00075, as the base instrument has been found lowly, pushing for hikes in inputs.
Each time that the pairing market tends to shift to the downside of those values, the outcome of the processes has been to produce better longing entries for long-term investors to latch on to. It would be acceptable for sellers to always be cautious of their new position orders in the sideways trading zones, as it has been the true sense of the technical point of the trade as opposed to the bears’ postures.
WSM/USD Market
Key Levels
Resistance levels: $0.0012, $0.0017, $0.0022
Support levels: $0.0007, $0.0005, $0.0003
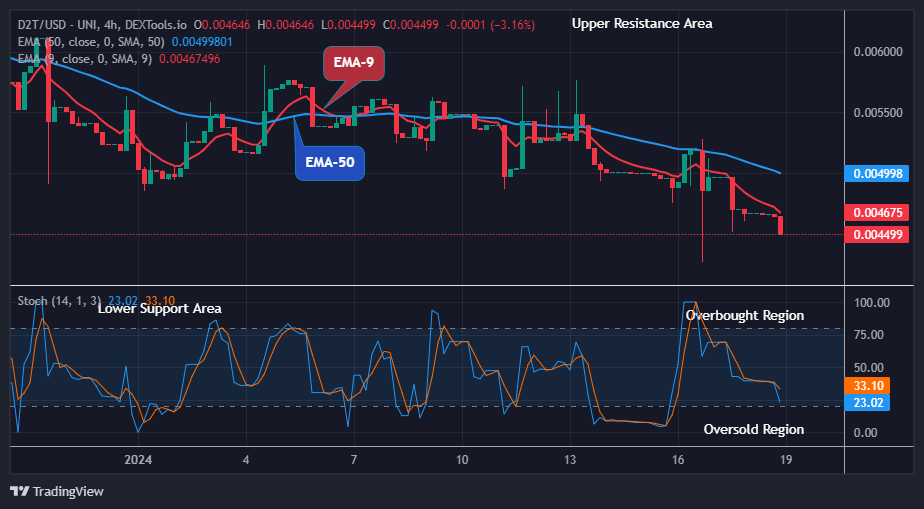
WSM/USD – 4-hour Chart
The WSM/USD market 4-hour chart mirrors that the crypto-economic price is lowly, pushing for hikes within the zones of $0.0012 and $0.00075.
The indicators have been observed sinking in the oversold area to indicate that the selling force is on the verge of losing out maybe soon after various stochastic oscillator swerving systems have passed through variation points that partially incorporate oversold and overbought areas. It has been noted that the lines of the Bollinger Bands stretch maximum to a lower end against which further candlestick characteristics may not fall stably.
Then, should the bears in the WSM/USD market try to push over the $0.00075 mark?
It has been overly demonstrated that furthering the efforts to push past the critical support point of $0.00075 will not be in line with technical thinking, as the WSM/USD market’s economy is lowly, pushing for hikes in inputs.
Consistent jerking behaviors to the lower horizontal line at $0.00075 have been present in the current trading signals, creating favorable conditions for strong rebounding forces. It is anticipated that buyers will constantly keep up with the majority of price swings, typically recovering from any given decline before possible long-term uptrend.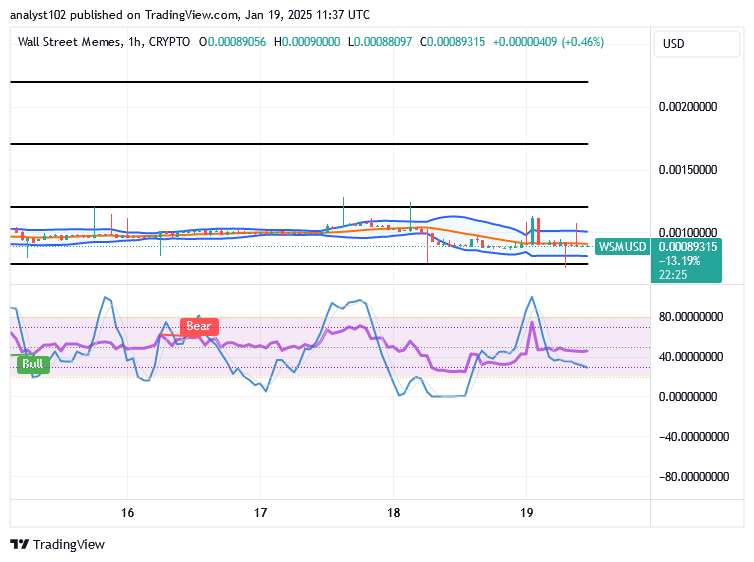
WSM/USD 1-hour chart
The 1-hour chart showcases that the WSM/USD market is lowly, pushing for hikes in inputs.
The hourly setup angle shows that the Bollinger Bands indicators have successfully moved in close proximity to the $0.00075 line. To show that the decreasing force is about to lose, the stochastic oscillators are repositioning at decreased trading zones.
Buy and stake WSM now!: Wall Street Meme (WSM)
I don’t make the rules pic.twitter.com/xRKp6gaCbQ
— Wall Street Memes (@wallstmemes) January 18, 2025