Quant Price Prediction: QNT/USD Approaches Key Support as Traders Eye Potential Reversal Amid Low Volatility
Estimated Reading Time: 3 minutes
Don’t invest unless you’re prepared to lose all the money you invest. This is a high-risk investment and you are unlikely to be protected if something goes wrong. Take 2 minutes to learn more
Quant Price Prediction: September 4, 2024
As Quant (QNT/USD) navigates a period of low volatility, traders closely monitor its approach to critical support levels. These levels could influence whether the price will rise or continue to fall.
The price is hovering near important points, and its future direction could either be a rebound or a further decline. Investors are waiting to see if Quant can recover and rise or if it will drop further.
QNT/USD Long-term Trend: Bearish (Daily Chart)
Key Levels:
Resistance Levels: $64.29, $65.00, and $70.53.
Support Levels: $50.00, $58.00, and $60.74.
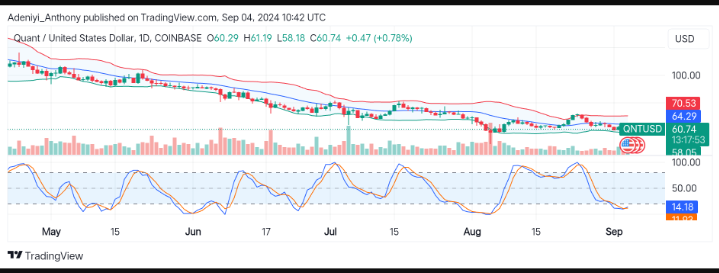
The QNT/USD daily chart shows the pair is on a prolonged downtrend, with price action confined below key moving averages.
However, the price is testing the $60.74 level, with a slight uptick noted. If bulls can maintain momentum, this could suggest the start of a potential recovery. Volume is relatively steady, indicating a lack of strong conviction from either bullish or bearish traders.
Quant Price Prediction: Condition for a Bullish Breakout
In the Quant market today, the Bollinger Bands are relatively narrow, reflecting reduced volatility in the recent weeks. The price is currently hovering near the middle band, with the upper band at $70.53 and the lower band near $58.05. A break above or below these bands could signal the beginning of a new trend, with the current consolidation phase likely to precede a significant move.
On the other hand, the Stochastic Relative Strength Index (RSI) shows a recovery from oversold conditions, though the oscillator remains in a downward trajectory, indicating that any bullish momentum might still be fragile. Traders should watch for potential crossovers that might suggest a shift in momentum.
QNT/USD Medium-term Trend: Bearish (4H Chart)
The 4-hour chart of (QNT/USD) shows a recent decline after a brief rally, with the price currently sitting at $60.68. The price has been fluctuating within a range, reflecting a period of consolidation after a downtrend. The latest price actions suggest a potential continuation of the bearish sentiment, though the price is approaching critical levels that could prompt a reversal.
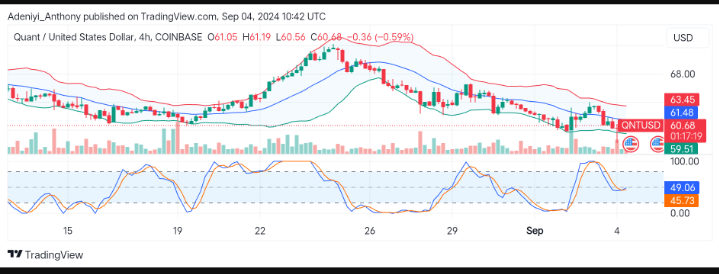
The price is currently below the dynamic resistance (middle band), indicating downward pressure. Although the Stochastic RSI is not in the oversold territory, it remains in a downward trend, further reinforcing the bearish sentiment.
Overall, the chart reflects a bearish trend with potential for further downside unless key support levels are held and indicators signal a reversal.
In order to place winning trades with us via Bybit, you can open an account here.