Lucky Block Price Prediction: LBLOCK/USD Trades Bullishly to Indicate Price Rally
Estimated Reading Time: 2 minutes
Don’t invest unless you’re prepared to lose all the money you invest. This is a high-risk investment and you are unlikely to be protected if something goes wrong. Take 2 minutes to learn more

Free Crypto Signals Channel
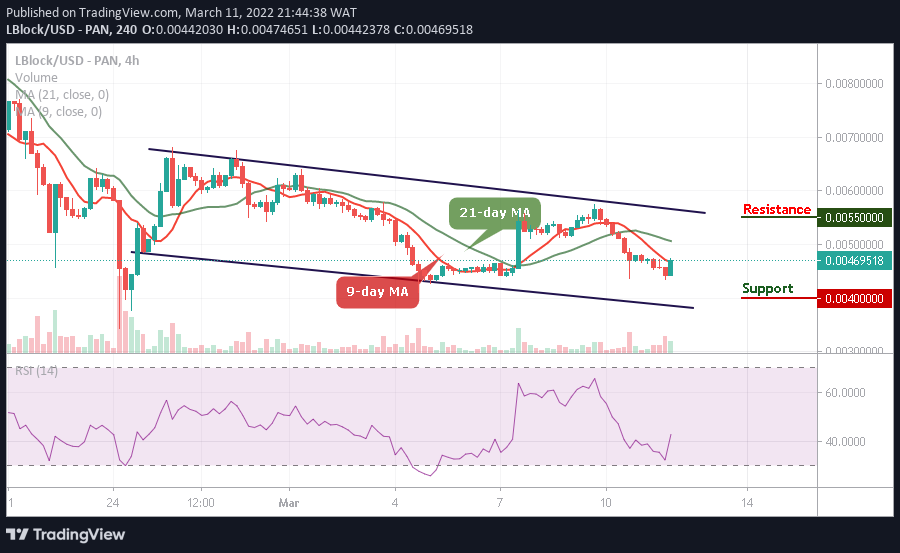
Looking at the 4-hour chart, the Lucky Block price prediction rides the bulls as traders are ready to have a great moment ahead.
LBLOCK/USD Long-term Trend: Bearish (4H Chart)
Key Levels:
Resistance levels: $0.0055, $0.0060, $0.0065
Support levels: $0.0040, $0.0035, $0.0030
If LBLOCK/USD trading volume increases significantly, a bullish run may continue to play out. Following the recent price, LBLOCK/USD is currently facing a potential resistance at $0.0050 level above the 9-day moving average. A break above the barrier would produce a huge green candle towards the upper boundary of the channel, marking resistance at $0.0055, $0.0060, $0.0065 levels.
Lucky Block Price Prediction: LBLOCK (Price) Ready for the Upside
At the time of writing, the Lucky Block price is moving bullishly as the coin begins a new upward movement. On the contrary, a bearish step back may roll the market back to the downside with a possible break down to $0.0040, $0.0035, and $0.0030 supports, and this could give room for the new buyers to come into the market. The technical indicator Relative Strength Index (14) crosses above 40-level due to a little price increase.
LBLOCK/USD Medium-term Trend: Ranging (2H Chart)
According to the 2-hour chart, the Lucky Block price is attempting to cross above the 9-day and 21-day moving averages, but as it appeared, there’s a low amount of buying pressure in the market which is why the price is finding it difficult to gain more upsides.
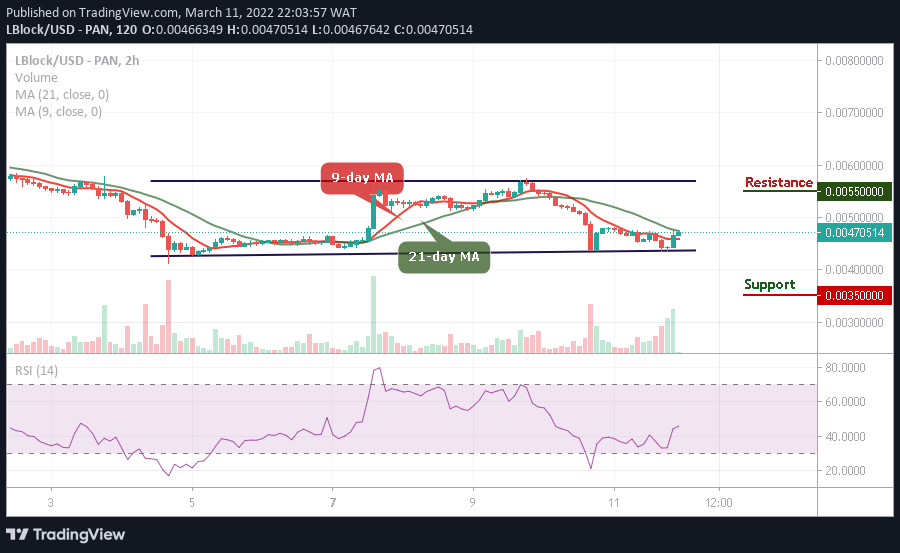
Moreover, if bears try to break down the price, one would expect the market to touch the support level of $0.0035 and below. Meanwhile, a bullish continuation would push the price to the resistance levels of $0.0055 and above as the technical indicator Relative Strength Index (14) moves to cross above 50-level.
Read more: