Shiba Inu (SHIBUSD) Continues Consolidation Rally
Estimated Reading Time: 3 minutes
Don’t invest unless you’re prepared to lose all the money you invest. This is a high-risk investment and you are unlikely to be protected if something goes wrong. Take 2 minutes to learn more

Price Analysis – Shiba Inu Loses Strength as Price Consolidate
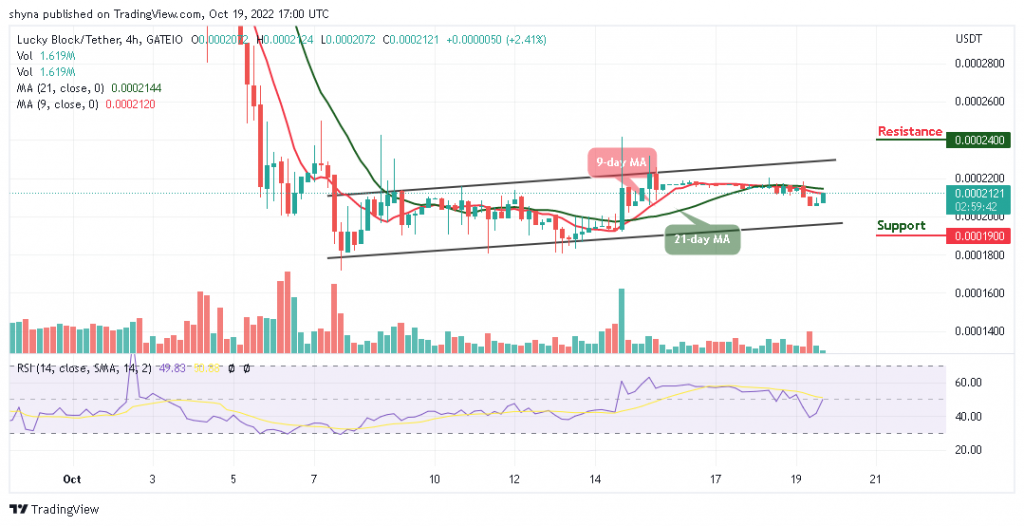
Shiba Inu continues its consolidation rally, with traders yet to take significant steps as the market remains trapped between the key levels of $0.00001430 and $0.00001370. Sellers are inching lower but are not displaying the urgency needed to push prices down decisively. Meanwhile, buyers have been relatively quiet, leading to a stalemate in the market.
SHIBUSD Key Levels
Support Levels: $0.00001370, $0.00001300
Resistance Levels: $0.00001430, $0.00001500

Despite this period of indecision, there is potential for traders to capitalize on the situation. The sellers appear to be a step ahead, and a breakout from the Bollinger Band indicator could yield favorable conditions for them. Traders should keep an eye out for price distribution in the coming days, as market dynamics could shift quickly.
The long-term outlook for Shiba Inu indicates that the market is currently in a state of indecision, with traders caught between key support and resistance levels. The consolidation between $0.00001430 and $0.00001370 suggests that both buyers and sellers are waiting for a catalyst to drive the market in one direction.
If sellers manage to break below the $0.00001370 support level, it could open the door for further declines toward $0.00001300. Conversely, a successful breakout above $0.00001430 would signal a renewed interest from buyers and could lead to an upward trend targeting the $0.00001500 resistance level.

Market Expectation
On the short-term chart, Shiba Inu indicates that sellers are gradually gaining ground, though the lack of strong liquidity may limit their impact. The Stochastic Oscillator shows that sellers currently hold the reins, but buyers could still make a comeback if they position themselves effectively.
The immediate focus for traders will be to watch for any signs of a breakout from the $0.00001430 resistance or a breach of the $0.00001370 support level. A strong move in either direction could set the stage for increased volatility and trading opportunities.
You can purchase Lucky Block here. Buy LBLOCK
Note: Cryptosignals.org is not a financial advisor. Do your research before investing your funds in any financial asset or presented product or event. We are not responsible for your investing result.