BNB (BNB/USDT) Prepares for a Short-term Bounce
Estimated Reading Time: 3 minutes
Don’t invest unless you’re prepared to lose all the money you invest. This is a high-risk investment and you are unlikely to be protected if something goes wrong. Take 2 minutes to learn more
BNB Long-term Analysis: Bullish
The market for BNB the native coin of Binance against the Tether (USDT) seems to be trending downward towards $642 after hitting the upper band in previous trade after hitting the upper band in previous trade. However, the positioning of the price in the upper segment of the Bollinger bands suggests the trend is still bullish.
Recently, the pair sought to push towards the mid-band as the Stochastic oscillator suggests the price might be positioned for a bounce soon.
To this end, as long as the price stays above the $640 level, the pair operates in a bullish region, suggesting traders are waiting for little improvement to take action.
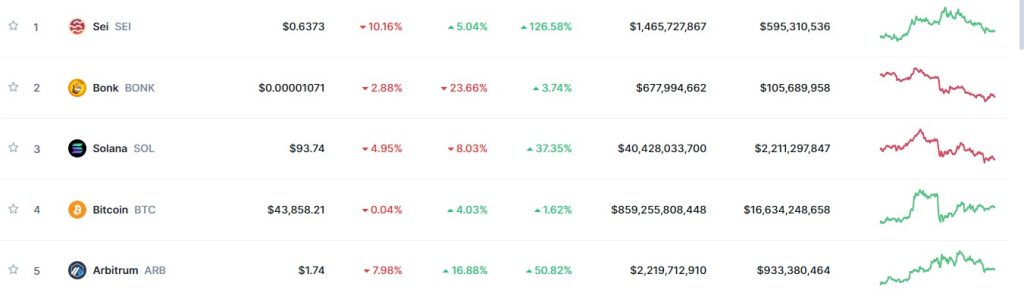
Currently, BNB is trading at $656.90 with 1.55 million trades, which shows low participation for the week.
Technical Indicators
Major Resistance Levels: $700, $750, and $800
Major Support Levels: $640, $600, and $537
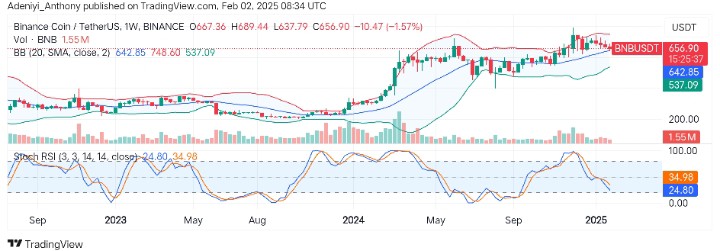
BNB Technical Analysis
The analysis of BNB against the USDT on the weekly timeframe shows that the pair was on a strong bullish momentum earlier before the current consolidation phase. However, as the price appears to be trading above the dynamic mid-band, the price nears the $642 level, seeking to break for a potential rebound in subsequent sessions.
From another angle, the Stochastic RSI signals the pair is oversold, as lines read below the 30-mark level. This suggests a possible reversal or continuation of the current trend if this condition persists.
To this end, given the oscillator’s oversold condition, a short-term bounce is possible if the price holds above $640 near the mid-band. Conversely, a dip below $640 could suggest a movement toward $537.09 is possible.
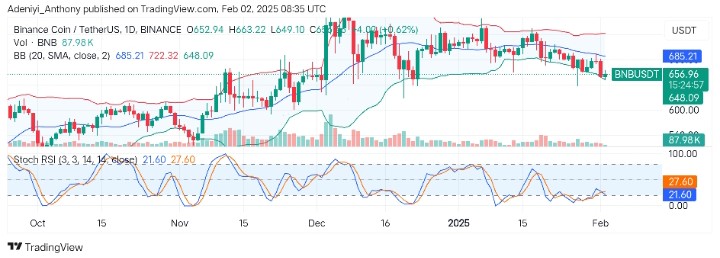
BNB/USDT Analysis: Where From Here?
On the daily timeframe, BNB/USDT is slightly recovering from a recent pullback after touching a lower level at $648.09. However, the operation of the pair around the lower band indicates an oversold condition with the possibility of seeing further reversal in the near term.
On the other hand, the oscillator suggests weakening momentum as the indicator’s lines extend forward along the 20-mark level. This signals the current movement lacks strong conviction.
To this end, if the current uptick is supported by good volume, the price may hit above $685 towards $722 if the influx of bullish traders increases. Conversely, a break below $648 could lead to further downside towards $600 in the short term.
You can purchase crypto coins here. Buy LBlock