Bitcoin (BTC/USD) Market Breaks Down at $40,000
Estimated Reading Time: 3 minutes
Don’t invest unless you’re prepared to lose all the money you invest. This is a high-risk investment and you are unlikely to be protected if something goes wrong. Take 2 minutes to learn more

Free Crypto Signals Channel
Bitcoin Price Prediction – February 20
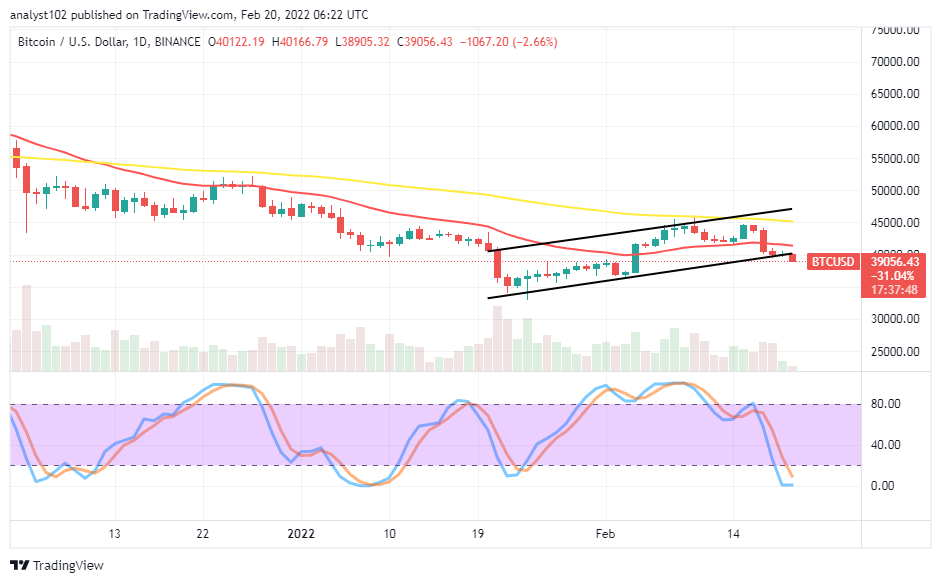
It has again recorded on the BTC/USD trade financial book of records that the crypto-economic market breaks down at $40,000 line. The crypto economy features between $39885 and $38,905, and the percentage rate of trading is at 1.95 negatives.
BTC/USD Market
Key Levels
Resistance levels: $42,500, $45,000, $47,500
Support levels: $37,500, $35,000, $32,500
BTC/USD – Daily Chart
The BTC/USD daily chart showcases that the crypto-economic market breaks down at a $40,000 level. And that value-line trading capacity is termed the critical spot of the recent rebounding moving mode of the crypto business operations. The 14-day SMA is underneath the 50-day SMA indicator. The Stochastic Oscillators are in the oversold region, seemingly attempting to close their lines within it. As of writing, a bearish candlestick is taking a form to denote that a falling force is ongoing.
Can there be an emergence of a bounce-off in the BTC/USD trade operations as the crypto-economic market breaks down at $40,000?
Presently, time seems not yet ripe to suggest a quick sustainable bounce-off in the BTC/USD trade operations as the crypto-economic market breaks down at $40,000 level. The downward pressure has featured on a lighter note with a slight-unweight motion in rebounding. Therefore, the situation isn’t providing decent entry for buying orders currently. Bulls may have to patiently stay alert to see whether there will be an ideal trading pattern between the support levels of $37,500 and $35,000 before considering a long order afterward when a bullish candlestick emerges to signal a return of rebounding motion.
On the downside of the technical analysis, the BTC/USD market bears now have to consolidate their appearances beneath the $40,000 psychological trading level as it has breached. Traders needed to be wary of exerting a short order while no active motion occurs as there has been an oversold reading situation for the crypto economy. It might not be too safe to launch more sell orders while a bullish candlestick of any length appears during the subsequent trading sessions.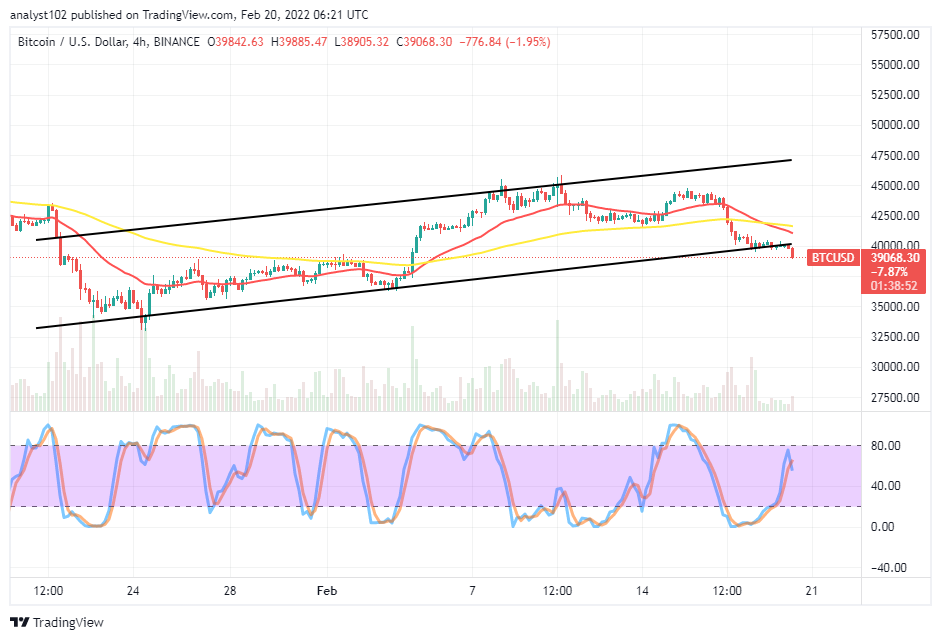
BTC/USD 4-hour Chart
The BTC/USD 4-hour chart showcases the crypto-economic market breaks down at $40,000 critical level around the lower bullish channel trend line that price formerly kept on the medium-term run. The 14-day SMA indicator has freshly intercepted the 50-day SMA indicator to the south side. The Stochastic Oscillators have crossed their lines southbound closely beneath the range of 80. A bearish candlestick appears positively in response to that situation, denoting that a falling force is currently prevailing over the crypto economy. The positioning of the stochastic Oscillators at lower ranges or oversold regions will have to wait to determine when there’ll be an insight to end this current falling force.
Note: Cryptosignals.org is not a financial advisor. Do your research before investing your funds in any financial asset or presented product or event. We are not responsible for your investing results.
You can purchase crypto coins here. Buy Tokens