Bitcoin (BTC/USD) Market Is in Ranges, Building a Base
Estimated Reading Time: 3 minutes
Don’t invest unless you’re prepared to lose all the money you invest. This is a high-risk investment and you are unlikely to be protected if something goes wrong. Take 2 minutes to learn more
Bitcoin Price Prediction – November 22
Over a couple of days, Bitcoin has been trading in ranges of $37,500 and $35,000, as the crypto-economic price is building a base toward the lesser value line.
Both the buyer and the seller may be apprehensive about attempting to push the deal inside the ranges indicated in the analytics paragraph above. While a correctional motion in the market is required, our prediction is that investors should stick to position-staking processes because the cycle has provided confirmation that it is capable of breaking through resistance and recovering past higher values from periods of bearish operations.
BTC/USD Market
Key Levels:
Resistance levels: $39,500, $42,000, $44,500
Support levels: $35,000, $32,500, $30,000
BTC/USD – Daily Chart
The BTC/USD daily chart reveals that the crypto-economic market is in ranges, building a base around the support of $35,000.
The Bollinger Band trend lines are in a northward direction, pointing around the values of $37,500 and $35,000. The stochastic oscillators have traversed into the oversold region, showcasing the potentiality of seeing the price run back upward. In the meantime, a smaller bullish candlestick is in the making to affirm that bulls are gaining momentum to push back as of this technical write-up.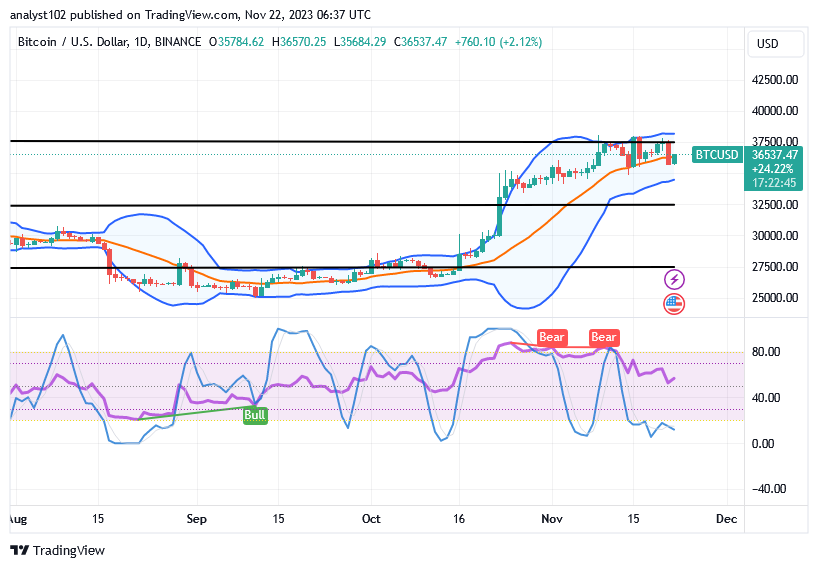
Given that the BTC/USD market is currently trading at $36,537.47, could there be any further increases from $35,000?
As of this point of analysis, the BTC/USD market buyers are gaining energy from the point of $35,000 to give the hope that investors are liable to gain more appreciative values, given the market is in ranges, building a base.
The comprehensive technical evaluation Nevertheless, it’s possible that there will be a few pullbacks towards the lower Bollinger Band’s point before the market finds the perfect amount of momentum to ignite a steady upward trend that can break over the natural resistance line at $37,500 or so.
For the time being, the ability to reverse pressure downward has been progressively weakening. It is a sentiment that the stochastic oscillators have positioned themselves to confirm. In light of those circumstances, bears are recommended to look for resistant-trading zones prior to reclaiming the $37,500–$40,000,000.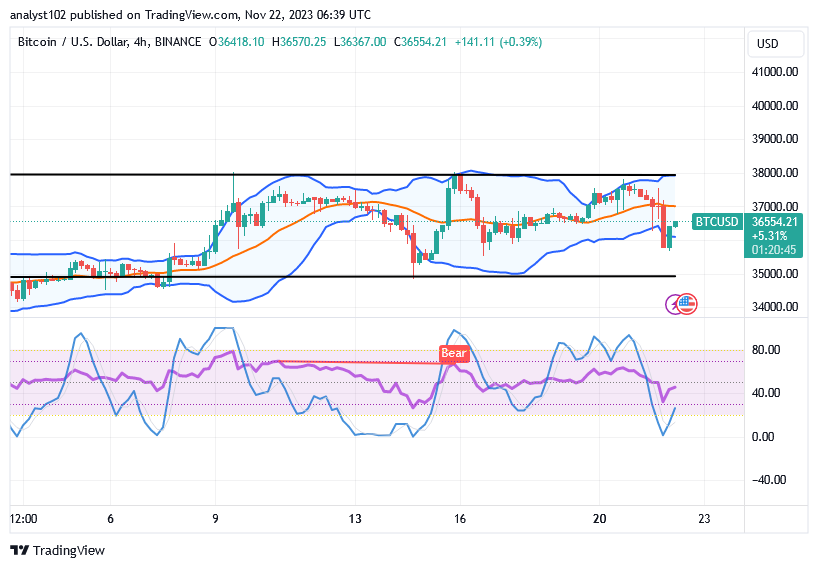
BTC/USD 4-hour Chart
The BTC/USD 4-hour chart showcases the cryptocurrency market in ranges of $38,000 and $35,000, building a base.
There have been horizontal lines drawn around the points of $38,000 and $35,000 to give the main points that the Bollinger Band trend lines have been surfacing. The oversold area is where the stochastic oscillators are. The price has been retracing its steps in the direction of or near the lower range line. The oscillators’ readings at lower points would be instrumental in predicting when to enter a long position. However, investment trade ideology has a higher chance of producing appreciation.
Note: Cryptosignals.org is not a financial advisor. Do your research before investing your funds in any financial asset or presented product or event. We are not responsible for your investing results.
You can purchase Lucky Block here. Buy LBLOCK