Bitcoin (BTC/USD) Price Is Lowly, Trading at Higher Zones
Estimated Reading Time: 4 minutes
Don’t invest unless you’re prepared to lose all the money you invest. This is a high-risk investment and you are unlikely to be protected if something goes wrong. Take 2 minutes to learn more
Bitcoin Price Prediction – November 18
Recently, several uprising velocities were generated to mark the presence of bulls versus bears, making the BTC/USD trade push averagely toward the value of $38,000, given that the crypto-economic price is lowly at this point below it, maintaining trading at higher zones above $35,000.
A closure technical outlook reveals the line of $35,000 and the point of $32,500 are likely to act as the major underlying support spots should bears add more weights alongside the current slight correctional movements in price. Investors who want to start at the present increasing trading level would still need to adhere to the buy and hold strategy, according to the argument against that opinion.
BTC/USD Market
Key Levels:
Resistance levels: $40,000, $42,500, $45,000
Support levels: $35,000, $32,500, $30,000
BTC/USD – Daily Chart
The BTC/USD daily chart reveals that the crypto-economic price is lowly against the point of $37,500, trading at higher zones of the Bollinger Bands’ confinement boundaries.
The stochastic oscillators’ indicators have had their blue part traverse southbound into the oversold region, leaving the other line to move toward the point of 40. The Bollinger Bands are situated upwardly to indicate that the current key resistance line lies around the point of $37,500.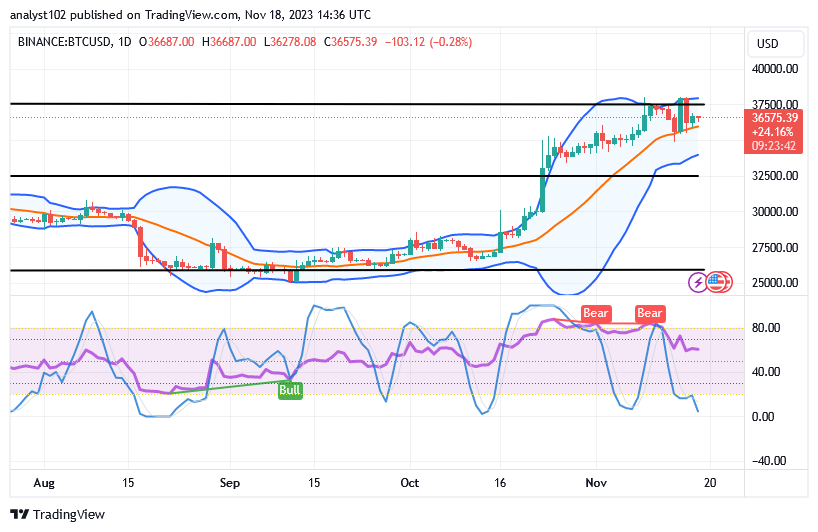
What moves do bulls often place at the upper side of the Bollinger indications about the BTC/USD market activities in the near future?
It has been demonstrated that BTC/USD market bulls are attempting to run in a range-bound style for a while around the value of $37,500 before going for a massive breakout, as it has been presently given that the crypto-economic trade is low, trading at higher zones above the critical underlying support of $35,000.
Less aggressive market practices have been dominating in the meantime, which occasionally results in a period of indecision. As a result, purchasers should use caution when placing new longing orders against the $37,500 level. However, positions opened around that psychological spot can be negated by swift reversal moves.
We beg sellers not to take extraordinary efforts toward executing positions without taking into consideration when there will be excellent reversal movements against major uprising forces in the market, having noticed where the bulls in the BTC/USD market tend to lose out with decency. When taking positions without seeing price activity to back them up, bears should proceed with extreme caution.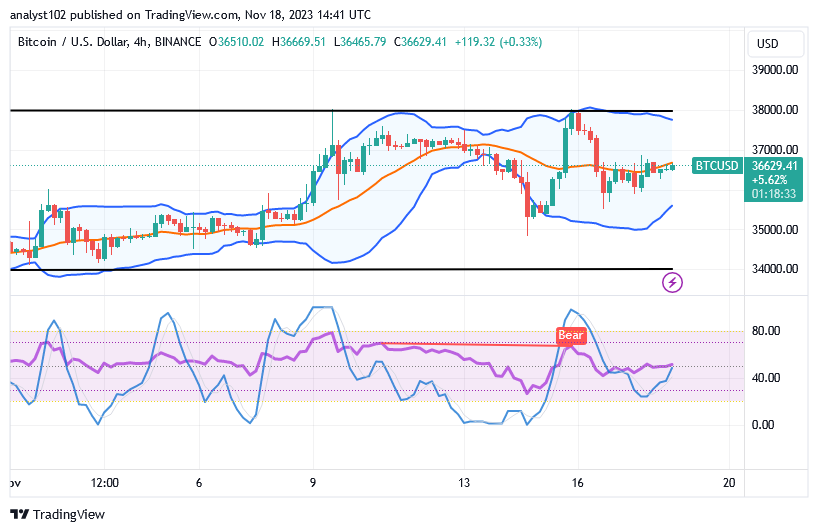
BTC/USD 4-hour Chart
The BTC/USD 4-hour chart shows the crypto trade is lowly around the point of $37,500, trading at higher zones.
The upper Bollinger Bands trend line remains around $38,000, the middle section remains around $36,500, and the lower part remains around $35,000. Lighter bullish candlestick forms have been seen in a few of them, suggesting that buyers are still holding onto some leverage. According to the current prognosis, the stochastic oscillators are attempting to climb back up, indicating that correctional impulses are about to become enfeebling.
Note: Cryptosignals.org is not a financial advisor. Do your research before investing your funds in any financial asset or presented product or event. We are not responsible for your investing results.
You can purchase Lucky Block here. Buy LBLOCK