Chiliz (CHZUSD) Price Crashes Down to $0.113500 Support Level
Estimated Reading Time: 3 minutes
Don’t invest unless you’re prepared to lose all the money you invest. This is a high-risk investment and you are unlikely to be protected if something goes wrong. Take 2 minutes to learn more
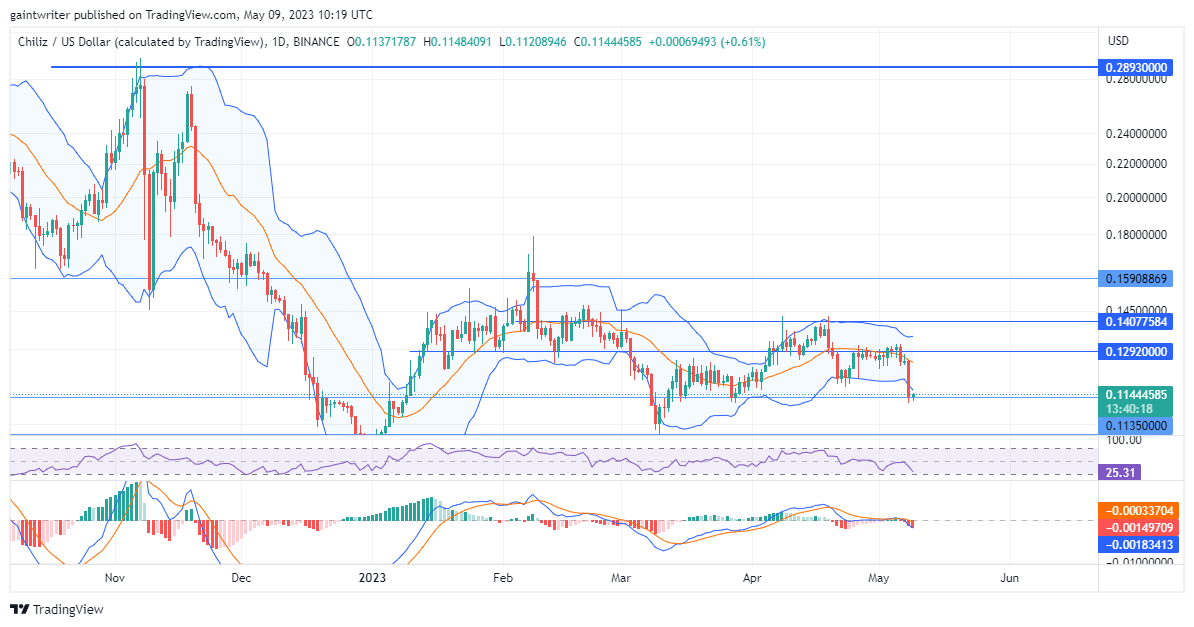
CHZUSD Analysis – Bears Find Support at the $0.113500 Key Level
Chiliz (CHZUSD) crashes down to the $0.113500 key zone. The cryptocurrency market has seen a surprising turn of events in the CHZUSD price. After a prolonged period of market stability and low activity. The recent crash of the CHZUSD to the $0.113500 key zone has been a surprise to many in the crypto market. For weeks, the price had been stuck in an aggregation range around $0.129200, with no real signs of momentum. However, the bears have come out in force and pushed the price down to the $0.113500 level, creating an opportunity for sellers to capitalize on.
CHZUSD Key Levels
Resistance Levels: $0.15900, $0.140700
Support Levels: $0.113500, $0.12920

The technical indicators are still pointing toward selling pressure as the Money Flow Index highlights the directional flow of the price. This could suggest that the bears are still looking for a possible price breakout in the next trading session.
The recent volatility of the CHZUSD has been a shock to many traders, as there had been little activity for so long. However, it does show that markets can quickly turn and that traders need to be vigilant and prepared for any eventuality. The key will be to identify the next level of support and resistance and use these levels to help guide their trading decisions. Keeping a close eye on the technical indicators will also be important, as these can give insight into the strength of the current trend.

Market Expectation
On the 4-hour chart, the recent market activity can be classified as a pullback. This indicates that buyers are successfully pushing the price above the $0.113500 support level. However, the MACD (Moving Average Convergence and Divergence) indicator is still on a negative slope, suggesting that sellers still have the potential to further impact the market. It is important to note that while buyers are currently in control, the negative slope of the MACD indicator should not be overlooked. This indicates that sellers still can influence the market. Traders must remain vigilant and keep an eye on any potential shifts in market activity.
You can purchase Lucky Block here. Buy LBLOCK
Note: Cryptosignals.orgis not a financial advisor. Do your research before investing your funds in any financial asset or presented product or event. We are not responsible for your investing results.