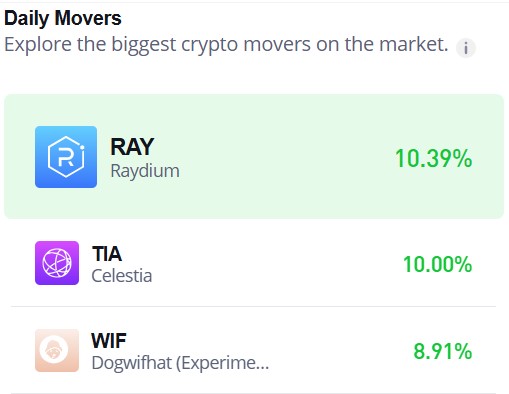
Raydium (RAY/USD) Eyes Potential Rebound from Key $2.00 Support
Estimated Reading Time: 3 minutes
Don’t invest unless you’re prepared to lose all the money you invest. This is a high-risk investment and you are unlikely to be protected if something goes wrong. Take 2 minutes to learn more
The Raydium market has been in a prolonged bearish trend. However, as it approaches the critical $2.00 price level, signs of a potential rebound are emerging. This level appears to be attracting bullish interest, as it has played a significant role in the market’s historical price action. Notably, the previous bull run originated from this point toward the end of last year and eventually peaked at $8.80 in late January of this year.
Despite bullish attempts to drive the market higher, sustained bearish pressure has consistently hindered upward momentum. The previous rally encountered strong resistance around the $5.50 level, where price consolidation occurred for a considerable period. Eventually, the bulls regained control, propelling the market to its recent peak of $8.80.
Raydium Market Data
- RAY/USD Price Now: $2.45
- RAY/USD Market Cap: $705.6 million
- RAY/USD Circulating Supply: 290.8 million RAY
- RAY/USD Total Supply: $554,99 million RAY
- RAY/USD CoinMarketCap Ranking: #90
Key Levels
- Resistance: $3.00, $4.00, and $5.00
- Support: $2.00, $1.50, and $1.00.
The Raydium Market Through the Lens of Indicators
Historically, the $2.00 price level has been a key support zone, playing a significant role in the last bull run, which sustained a rally until the price peaked at $8.80. In addition to this historical significance, the Relative Strength Index (RSI) is signaling that the market is poised for a recovery, with the price potentially surging above $4.00 soon. However, this outlook largely depends on the current trading volume.
While the ongoing trading session has a substantial volume, it is not as strong as the previous one. This crypto signal could be attributed to the increased bearish activity over the past two to three trading sessions, which led to downside volatility and heavy selling pressure. Now, as the Raydium market encounters bullish sentiment at this level, a battle between buyers and sellers has created indecision among traders. This struggle between supply and demand may explain why the recovery is not as strong as expected. As a result, the market could consolidate around this level for some time before a clear directional move emerges.
RAY/USD Price Prediction: 4-Hour Chart Analysis
From a 4-hour chart perspective, the Raydium market is consolidating above the $2.00 price level as demand and supply reach equilibrium, resulting in a sideways trading pattern. The recent bullish recovery from this critical support—driven by buying interest at this level—continues to face strong selling pressure, keeping the market in consolidation.
If the bulls maintain their position, this phase of consolidation may persist until bearish momentum weakens, potentially creating an opportunity for a breakout and upward movement.